
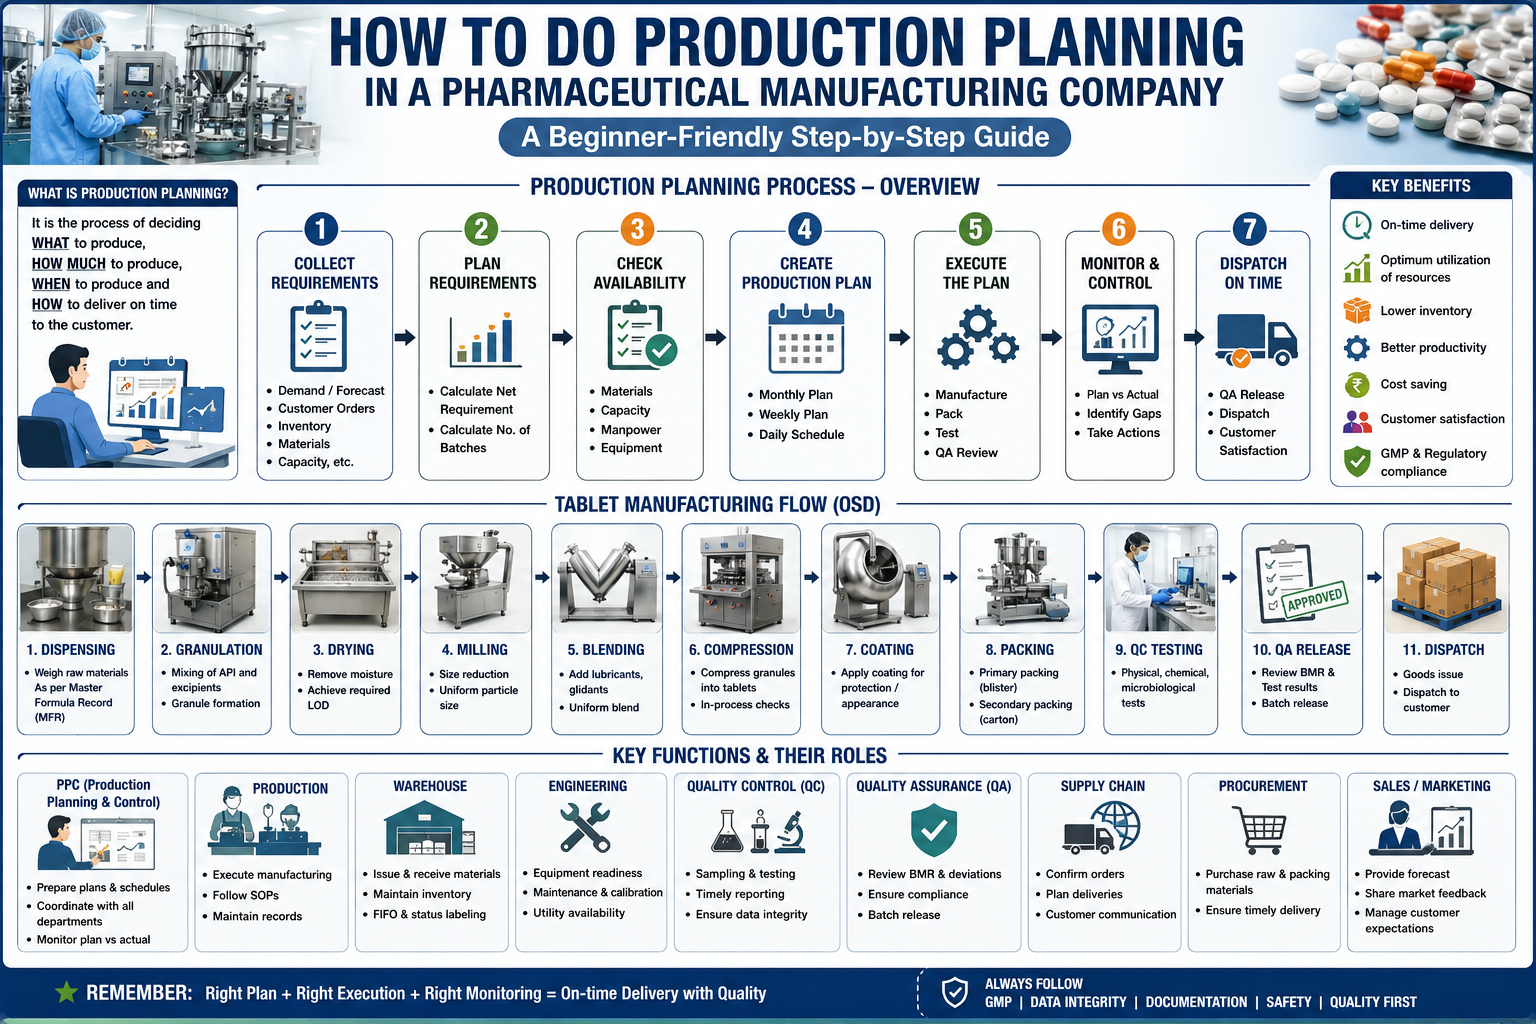
Production planning is one of the most important activities in a pharmaceutical manufacturing company.
A factory may have modern machines, trained employees, sufficient materials, and strong quality systems. But without proper production planning, the company may still face delayed batches, machine overload, material shortages, excess inventory, missed dispatches, and poor customer service.
This guide explains the complete pharmaceutical production planning process in simple language using an Oral Solid Dosage (OSD) tablet manufacturing plant as the main example.
The complete planning flow is:
Demand → Inventory Check → Net Requirement → Batch Calculation → Material Check → Capacity Check → Lead-Time Calculation → Prioritization → Monthly Plan → Weekly Plan → Daily Schedule → Execution → Monitoring → Recovery → QC Testing → QA Release → Dispatch
1. What Is Production Planning?
Imagine that you are preparing food for a wedding.
You expect 1,000 guests.
Before starting cooking, you need to know:
How many guests will attend?
How much food is required?
What ingredients are available?
How many cooks are available?
How many cooking vessels are available?
How much time is required?
When should cooking start?
Which dishes should be prepared first?
The same logic applies to pharmaceutical production.
Suppose a company must supply 10 million tablets during July.
The production planner must determine:
How many tablets are already available?
How many tablets must be manufactured?
How many batches are required?
Are raw materials available?
Are packing materials available?
Which machines will manufacture the batches?
How many hours are available?
When should manufacturing start?
When should packing finish?
How much time will QC testing require?
When can QA release the batches?
Will the products be ready before the customer delivery date?
Production planning means deciding what to manufacture, how much to manufacture, where to manufacture it, when to manufacture it, and when it must be completed.
Important Planning Terms
| Term | Simple Meaning | Example |
|---|---|---|
| Demand | Quantity required by the market | 10 million tablets |
| Forecast | Expected future demand | Sales expects 12 million tablets next month |
| Customer Order | Confirmed requirement | Customer orders 5 million tablets |
| Production Target | Quantity the factory must produce | Manufacture 9 million tablets |
| Production Plan | Overall plan for achieving the target | Manufacture 18 batches during July |
| Production Schedule | Exact timing of production activities | Batch 001 on Granulator-1 Monday at 8:00 AM |
| Production Execution | Actual manufacturing activities | Operators manufacture the batch |
| Dispatch Plan | Plan for shipping released products | Dispatch 3 million tablets on 25 July |
A simple rule is:
Forecast tells us what may be required.
Demand tells us what is required.
The production plan tells us how the factory will manufacture it.
The production schedule tells us exactly when and where it will happen.
2. Information Required Before Making a Production Plan
A production planner should never start planning with only the sales demand.
A realistic plan requires information from Sales, Supply Chain, Warehouse, Procurement, Production, Engineering, QC, and QA.
2.1 Monthly Sales Forecast
The forecast estimates future market requirements.
Example:
Product A forecast = 10 million tablets.
Product B forecast = 5 million tablets.
The forecast helps the company purchase materials and reserve manufacturing capacity.
2.2 Confirmed Customer Orders
Confirmed orders normally receive greater attention because the company has committed to delivering the product.
Example:
Forecast = 10 million tablets.
Confirmed orders = 8 million tablets.
The planner must ensure the confirmed orders are protected while considering forecast demand and inventory policy.
2.3 Delivery Dates
Every order has a required delivery date.
If Product A must be dispatched on 15 July and Product B on 30 July, Product A will normally receive higher priority, assuming all other requirements are ready.
2.4 Finished Goods Inventory
These are manufactured, packed, and released products available for supply.
If demand is 10 million tablets and 2 million released tablets are available, the planner does not need to manufacture the entire 10 million.
2.5 Work-in-Progress Inventory
Work-in-progress, or WIP, means material that has started manufacturing but is not yet a released finished product.
Examples include:
Granules awaiting compression.
Compressed tablets awaiting coating.
Coated tablets awaiting packing.
Packed batches awaiting QC results or QA release.
The planner must consider usable WIP to avoid unnecessary production.
2.6 Raw Materials
The planner checks whether API and excipients are available.
API means Active Pharmaceutical Ingredient.
It is the ingredient responsible for the medicine’s therapeutic effect.
Excipients are other ingredients used to manufacture the tablet.
2.7 Packing Materials
These include:
Primary packing materials such as PVC, PVDC, aluminium foil, bottles, and caps.
Secondary packing materials such as cartons, labels, leaflets, and shippers.
A batch cannot be dispatched simply because manufacturing is complete. It must also be packed.
2.8 Material Lead Time
Lead time is the time between ordering material and having approved material available for production.
Suppose an API requires:
45 days for supplier manufacturing and delivery.
5 days for QC testing.
The effective material lead time is approximately 50 days.
The planner must consider this before committing production dates.
2.9 Batch Size
A batch is a defined quantity manufactured under one batch manufacturing record.
Example:
Batch size = 500,000 tablets.
Demand = 5 million tablets.
Required batches = 10.
2.10 Manufacturing Cycle Time
Cycle time is the time required to complete an operation or manufacturing stage.
Examples:
Granulation = 8 hours.
Compression = 16 hours.
Coating = 10 hours.
Packing = 24 hours.
The planner uses these times to calculate machine loading.
2.11 Equipment Availability
A machine may exist but may not be available.
Reasons include:
Preventive maintenance.
Breakdown.
Qualification.
Calibration.
Cleaning.
Product changeover.
Validation batches.
Therefore:
Installed capacity is not the same as available capacity.
2.12 Manpower Availability
Machines require trained and qualified employees.
A company may have sufficient machines but insufficient operators, technicians, or inspectors.
The production planner must therefore check shift-wise manpower availability.
2.13 Preventive Maintenance
Engineering may schedule equipment maintenance.
These hours must be deducted from available production time.
2.14 Changeover and Cleaning Time
Changing from one product to another requires cleaning, line clearance, documentation, and equipment setup.
Frequent product changes can significantly reduce production capacity.
2.15 Campaign Manufacturing
Campaign manufacturing means producing several consecutive batches of the same product or product family.
Example:
Instead of:
A → B → A → C → A
Plan:
A → A → A → B → C
This can reduce changeovers and improve capacity utilization, provided GMP and contamination-control requirements are met.
2.16 QC Testing Time
Manufactured batches require laboratory testing.
Testing time must be included in the dispatch plan.
2.17 QA Release Time
After testing is complete, Quality Assurance reviews batch records, deviations, results, and other required documents before releasing the batch.
2.18 Regulatory and Market Priorities
Certain products may receive higher priority because of:
Government tenders.
Export commitments.
Product shortages.
Critical medicines.
Launch batches.
Regulatory commitments.
The production planner must know these priorities.
3. Convert Demand into Production Requirements
Consider the following example.
Monthly demand = 10 million tablets.
Finished goods inventory = 2 million tablets.
Required safety stock = 1 million tablets.
The formula is:
Net Production Requirement = Demand + Safety Stock − Available Finished Goods Inventory
Therefore:
10 + 1 − 2 = 9 million tablets.
The factory must manufacture 9 million tablets.
Now calculate batches.
Batch size = 500,000 tablets.
Required quantity = 9,000,000 tablets.
Required Batches = Net Production Requirement ÷ Batch Size
9,000,000 ÷ 500,000 = 18 batches.
Therefore, the production planner must plan 18 batches.
What If the Number Is Not Exactly Divisible?
Suppose:
Net requirement = 9.2 million tablets.
Batch size = 500,000 tablets.
9,200,000 ÷ 500,000 = 18.4 batches.
Normally, the planner cannot manufacture 0.4 of a validated commercial batch unless an approved variable batch-size strategy exists.
Therefore, the planner may need to plan 19 full batches.
Production quantity:
19 × 500,000 = 9.5 million tablets.
The additional 300,000 tablets contribute to inventory, subject to shelf-life, demand, working-capital, and inventory-policy considerations.
4. Check Material Availability
Calculating batches is not enough.
The planner must determine whether those batches can actually be manufactured.
Assume each batch requires:
API = 100 kg.
Excipient = 400 kg.
Coating material = 20 kg.
PVC = 250 kg.
Aluminium foil = 100 kg.
Cartons = 25,000 units.
For 18 batches:
API requirement = 1,800 kg.
Excipient requirement = 7,200 kg.
Coating material requirement = 360 kg.
The planner compares requirements against usable inventory.
| Material | Required | Available Approved Stock | Shortage |
|---|---|---|---|
| API | 1,800 kg | 1,500 kg | 300 kg |
| Excipient | 7,200 kg | 8,000 kg | None |
| Coating Material | 360 kg | 400 kg | None |
The API shortage means three batches cannot currently be manufactured.
Material Status Is Important
Materials may be:
Under Test: QC testing is incomplete.
Approved: Material can be used.
Blocked: Material is temporarily prevented from use.
Rejected: Material cannot be used.
Expired: Material cannot be used unless handled through an approved GMP process where applicable.
The planner should not treat under-test, blocked, rejected, or expired material as freely available production stock.
The correct question is not:
“Is material physically present?”
The correct question is:
“Is sufficient approved and usable material available when production needs it?”
5. Calculate Available Production Capacity
Capacity means how much work the factory can perform during a given period.
Suppose one compression machine is available for 30 days.
The factory operates 24 hours per day.
Total calendar hours:
30 × 24 = 720 hours.
Now deduct:
Preventive maintenance = 24 hours.
Cleaning = 40 hours.
Changeovers = 32 hours.
Other planned downtime = 24 hours.
Available production hours:
720 − 24 − 40 − 32 − 24 = 600 hours.
Therefore:
Available Production Capacity = 600 machine-hours.
Important Capacity Terms
Design Capacity
Maximum theoretical output under ideal conditions.
Example:
Machine rated speed = 300,000 tablets/hour.
Available Capacity
Capacity remaining after planned unavailable time is deducted.
Effective Capacity
Realistically achievable output considering normal operational losses.
Utilization
Utilization % = Actual Output ÷ Design Capacity × 100
Example:
Actual output = 80 million tablets.
Design capacity = 100 million tablets.
Utilization = 80%.
Efficiency
Efficiency % = Actual Output ÷ Expected Output × 100
Expected output = 90 million tablets.
Actual output = 81 million tablets.
Efficiency = 90%.
OEE
OEE means Overall Equipment Effectiveness.
OEE = Availability × Performance × Quality
Suppose:
Availability = 90%.
Performance = 95%.
Quality = 98%.
OEE:
0.90 × 0.95 × 0.98 × 100 = 83.79%.
OEE helps identify losses related to downtime, operating speed, and quality.
6. Understand the Manufacturing Route
A typical tablet manufacturing route is:
Dispensing → Granulation → Drying → Milling → Blending → Compression → Coating → Packing → QC Testing → QA Release → Dispatch
Dispensing
Approved raw materials are weighed according to the Batch Manufacturing Record.
Granulation
Powders are converted into granules suitable for tablet manufacturing.
Drying
Moisture is removed to the required level.
Milling
Granules are passed through a mill to obtain the required particle-size distribution.
Blending
Granules are mixed with lubricants and other required ingredients.
Compression
The final blend is compressed into tablets.
Coating
Tablets are coated when required by the product process.
Packing
Tablets are packed into blisters, strips, bottles, or other approved packs.
QC Testing
Samples are tested against approved specifications.
QA Release
QA reviews the manufacturing, packing, testing, deviations, and associated records before batch disposition.
Dispatch
Released finished goods are shipped according to the dispatch plan.
A planner must understand this route because a delay at one stage affects every downstream activity.
7. Calculate Manufacturing Lead Time
Consider one batch.
| Activity | Processing/Waiting Time |
|---|---|
| Dispensing | 4 hours |
| Granulation | 8 hours |
| Drying | 6 hours |
| Milling | 2 hours |
| Blending | 4 hours |
| Compression | 16 hours |
| Coating | 10 hours |
| Packing | 24 hours |
| QC Testing | 72 hours |
| QA Release | 24 hours |
Total theoretical lead time:
4 + 8 + 6 + 2 + 4 + 16 + 10 + 24 + 72 + 24 = 170 hours.
170 hours ÷ 24 = approximately 7.1 days.
In reality, queue time, sampling, material movement, weekends, laboratory workload, documentation corrections, equipment waiting, and shift patterns can increase total lead time.
Therefore, the planner should use realistic historical lead times rather than only theoretical processing time.
Backward Scheduling
Suppose the batch must be dispatched on 30 July.
QA release requires 1 day.
QC testing requires 3 days.
Packing requires 1 day.
Manufacturing requires 3 days.
The planner works backward.
Dispatch: 30 July.
QA release complete: 29 July.
QC testing complete: 28 July.
Packing complete: 25 July.
Manufacturing complete: 24 July.
Manufacturing must therefore start around 21 July, allowing additional safety time where appropriate.
This is called backward scheduling.
8. Prepare the Monthly Production Plan
Assume the following demand.
| Product | Demand (Million Tablets) | Inventory | Safety Stock | Net Requirement | Batch Size (Million) | Required Batches | Priority | Completion Date |
|---|---|---|---|---|---|---|---|---|
| Product A | 10 | 2 | 1 | 9 | 0.5 | 18 | High | 15 July |
| Product B | 6 | 1 | 0.5 | 5.5 | 0.5 | 11 | Medium | 22 July |
| Product C | 4 | 1 | 0.5 | 3.5 | 0.25 | 14 | High | 18 July |
| Product D | 8 | 3 | 1 | 6 | 1.0 | 6 | Low | 30 July |
| Product E | 5 | 0.5 | 0.5 | 5 | 0.5 | 10 | Medium | 25 July |
The planner now checks:
Materials.
Manufacturing capacity.
Packing capacity.
Equipment compatibility.
Maintenance schedules.
QC capacity.
QA release requirements.
Delivery dates.
Product priorities.
The monthly plan should only contain quantities that are reasonably achievable.
An unrealistic target is not a production plan.
It is only a wish list.
9. Convert the Monthly Plan into a Weekly Plan
Suppose Product A requires 18 batches.
A possible weekly allocation is:
| Product | Week 1 | Week 2 | Week 3 | Week 4 | Total |
|---|---|---|---|---|---|
| Product A | 10 | 8 | 0 | 0 | 18 |
| Product B | 2 | 4 | 5 | 0 | 11 |
| Product C | 7 | 7 | 0 | 0 | 14 |
| Product D | 0 | 1 | 2 | 3 | 6 |
| Product E | 0 | 2 | 4 | 4 | 10 |
The planner must verify that weekly loading does not exceed available capacity.
For example, scheduling 25 compression batches in Week 1 is useless if compression capacity is only 15 batches.
The planner balances the load across departments.
This is called finite capacity planning when the plan respects actual available capacity.
10. Convert the Weekly Plan into a Daily Production Schedule
A daily schedule tells the shop floor exactly what should happen.
| Date | Product | Batch | Stage | Equipment | Start | Finish | Cleaning/Changeover | Department | Status |
|---|---|---|---|---|---|---|---|---|---|
| 1 July | A | A001 | Granulation | RMG-01 | 08:00 | 16:00 | 2 hrs | Production | Planned |
| 1 July | C | C001 | Compression | CT-03 | 07:00 | 23:00 | 3 hrs | Production | In Progress |
| 2 July | A | A001 | Compression | CT-01 | 06:00 | 22:00 | 2 hrs | Production | Planned |
| 2 July | E | E001 | Coating | CP-02 | 08:00 | 18:00 | 3 hrs | Production | Planned |
| 3 July | C | C001 | Packing | BP-04 | 07:00 | 07:00 Next Day | 4 hrs | Packing | Planned |
The supervisor uses the schedule to arrange:
Operators.
Equipment.
Documents.
Materials.
Cleaning.
Line clearance.
In-process testing.
Material movement.
The planner updates actual start and finish times to monitor schedule adherence.
11. Production Sequencing
Production sequencing means deciding the order in which products and batches should run.
The planner considers:
Delivery dates.
Market priority.
Material readiness.
Equipment compatibility.
Cleaning requirements.
Campaign opportunities.
Product potency.
Tablet color.
Cross-contamination risks.
Sensitizing materials.
Changeover requirements.
Poor Sequence
White Product A → Dark Red Product B → White Product A → Blue Product C → White Product A.
This creates repeated cleaning and changeovers.
Better Sequence
White Product A → White Product A → White Product A → Blue Product C → Dark Red Product B.
This may reduce cleaning and changeover time.
However, sequencing decisions must always comply with approved contamination-control strategies, cleaning validation requirements, product-specific restrictions, and GMP procedures.
Efficiency cannot override patient safety or GMP requirements.
12. Identify Bottlenecks
Imagine a highway.
Five lanes suddenly become one lane.
Traffic accumulates.
That narrow point is the bottleneck.
The same happens in manufacturing.
Suppose weekly capacities are:
Granulation = 30 batches.
Compression = 20 batches.
Coating = 25 batches.
Packing = 15 batches.
The factory cannot sustainably produce 30 finished batches per week because packing can only handle 15.
Packing is the bottleneck.
Theory of Constraints
The Theory of Constraints can be explained in five simple steps:
Identify the bottleneck.
Use the bottleneck as effectively as possible.
Organize other activities to support the bottleneck.
Increase bottleneck capacity when justified.
Repeat the process because the bottleneck may move.
The production planner should protect bottleneck equipment from avoidable waiting.
13. Prepare Capacity vs. Demand Analysis
| Department | Available Hours | Required Hours | Loading % | Situation | Corrective Action |
|---|---|---|---|---|---|
| Granulation | 600 | 540 | 90% | Acceptable | Monitor |
| Compression | 1,000 | 1,150 | 115% | Overloaded | Add shift/resequence/use alternate machine |
| Coating | 500 | 400 | 80% | Available Capacity | Support schedule flexibility |
| Packing | 900 | 1,080 | 120% | Overloaded | Overtime/alternate line/campaign planning |
| QC | 800 | 920 | 115% | Overloaded | Prioritize samples and rebalance resources |
When demand exceeds capacity, possible actions include:
Reduce avoidable downtime.
Add shifts or approved overtime.
Use compatible alternate equipment.
Reduce unnecessary changeovers.
Improve campaign planning.
Subcontract activities where legally and technically approved.
Negotiate delivery priorities.
Increase capacity through long-term investment.
The planner should not simply load more work onto an already overloaded department.
14. Create a Production Planning Excel Workbook
A beginner can start with a simple workbook.
Sheet 1: Demand Plan
Suggested columns:
Product.
Forecast.
Confirmed Orders.
Delivery Date.
Priority.
Sheet 2: Inventory Status
Product.
Released Finished Goods.
WIP.
Safety Stock.
Usable Inventory.
Sheet 3: Material Availability
Product.
Material Code.
Material Description.
Required Quantity.
Approved Stock.
Under-Test Stock.
Expected Release Date.
Purchase Order Quantity.
Expected Delivery Date.
Shortage.
Sheet 4: Batch Requirement Calculator
Product.
Net Requirement.
Batch Size.
Required Batches.
Simple Excel formula:
=ROUNDUP(Net_Requirement/Batch_Size,0)
Sheet 5: Equipment Capacity
Equipment.
Calendar Hours.
Maintenance Hours.
Cleaning Hours.
Changeover Hours.
Other Downtime.
Available Hours.
Formula:
=Calendar_Hours-Maintenance_Hours-Cleaning_Hours-Changeover_Hours-Other_Downtime
Sheet 6: Monthly Production Plan
Product.
Required Batches.
Material Status.
Capacity Status.
Priority.
Required Completion Date.
Planned Month.
Sheet 7: Weekly Production Plan
Product.
Week 1.
Week 2.
Week 3.
Week 4.
Total Planned.
Sheet 8: Daily Production Schedule
Date.
Product.
Batch.
Stage.
Equipment.
Planned Start.
Planned Finish.
Actual Start.
Actual Finish.
Delay.
Reason.
Status.
Sheet 9: Production Tracking
Date.
Product.
Planned Quantity.
Actual Quantity.
Variance.
Plan Attainment.
Delay Reason.
Corrective Action.
Owner.
Target Date.
Sheet 10: Plan vs. Actual Dashboard
Recommended KPIs:
Production Plan Attainment.
Schedule Adherence.
Capacity Utilization.
OEE.
OTIF.
Yield.
RFT.
Delayed Batches.
Material Shortages.
Pending QC Samples.
Pending QA Releases.
15. Production Plan Execution
After approval, the plan moves to execution.
PPC
Prepares and communicates the plan.
Coordinates departments.
Tracks progress.
Identifies delays.
Coordinates recovery plans.
Production
Arranges manpower.
Verifies equipment readiness.
Executes manufacturing.
Completes GMP documentation.
Performs in-process controls.
Warehouse
Maintains material availability.
Ensures correct material status.
Dispenses and issues approved materials.
Controls storage and material movement.
Procurement
Places purchase orders.
Follows suppliers.
Expedites critical materials.
Manages supplier delivery commitments.
Engineering
Maintains equipment and utilities.
Performs preventive maintenance.
Responds to breakdowns.
Coordinates technical availability.
QC
Samples and tests materials and products.
Communicates testing status.
Supports investigation of out-of-specification results when required.
QA
Provides line clearance where applicable.
Reviews GMP documentation.
Manages deviations and quality-system requirements.
Reviews batch records.
Performs batch disposition and release according to procedures.
Supply Chain
Balances demand, inventory, supply, and customer commitments.
Coordinates dispatch priorities.
The plan succeeds only when these departments work as one system.
16. Daily Production Review Meeting
A short, disciplined 15-minute review meeting can significantly improve execution.
Suggested Agenda
Minutes 1–3: Yesterday’s Plan vs. Actual
What was planned?
What was completed?
What was delayed?
Minutes 4–6: Today’s Target
What batches must be manufactured?
What must be packed?
What critical activities are planned?
Minutes 7–10: Constraints
Material shortages.
Equipment breakdowns.
Manpower shortages.
Quality issues.
QC pending samples.
QA pending releases.
Minutes 11–13: Recovery Actions
What must be done?
Who owns the action?
When will it be completed?
Minutes 14–15: Escalations
Which issues require management support?
The meeting should end with:
Problem → Action → Owner → Deadline
17. Plan vs. Actual Production Tracking
Production Plan Attainment
Plan Attainment % = Actual Production ÷ Planned Production × 100
Plan = 100 batches.
Actual = 92 batches.
Attainment = 92%.
Schedule Adherence
A simple batch-based calculation is:
Schedule Adherence % = Activities Completed On Schedule ÷ Total Scheduled Activities × 100
90 activities were scheduled.
81 finished on time.
Schedule adherence = 90%.
Capacity Utilization
Capacity Utilization % = Actual Operating Hours ÷ Available Production Hours × 100
Available hours = 600.
Operating hours = 510.
Utilization = 85%.
OEE
OEE = Availability × Performance × Quality
Availability = 90%.
Performance = 95%.
Quality = 98%.
OEE = 83.79%.
OTIF
OTIF means On-Time In-Full.
OTIF % = Orders Delivered On Time and In Full ÷ Total Orders × 100
100 orders.
93 delivered on time and in full.
OTIF = 93%.
Yield
Yield % = Actual Acceptable Output ÷ Theoretical Output × 100
Theoretical output = 1,000 kg.
Acceptable output = 970 kg.
Yield = 97%.
Right First Time
RFT means Right First Time.
A practical calculation is:
RFT % = Batches Completed Without Rework, Reprocessing, or Correctable Execution Error ÷ Total Batches × 100
95 batches meet the approved RFT definition.
100 batches were produced.
RFT = 95%.
Companies should define KPI formulas consistently in approved procedures because definitions can differ between organizations.
18. What to Do When the Production Plan Fails
Plans will not always run exactly as expected.
The planner needs a structured recovery process.
Raw Material Unavailable
Check alternate approved lots.
Expedite procurement.
Reschedule another material-ready product.
Review inventory allocation.
Escalate customer risk.
Packing Material Delayed
Complete bulk manufacturing only if hold-time limits, storage capacity, demand risk, and procedures allow.
Reschedule packing lines.
Expedite suppliers.
Prioritize critical markets.
Equipment Breakdown
Estimate repair duration.
Check alternate qualified equipment.
Resequence production.
Protect bottleneck operations.
Evaluate approved overtime or additional shifts.
Manpower Shortage
Reallocate trained employees.
Adjust shift patterns.
Use approved overtime.
Prioritize critical products.
Batch Failure or Rejection
Immediately assess supply impact.
Do not assume rejected quantity can simply be replaced.
Check materials and capacity for replacement production.
Coordinate with QA and Supply Chain.
QC Testing Delay
Prioritize samples according to dispatch risk.
Review laboratory workload.
Escalate critical testing constraints.
Improve sample scheduling.
QA Release Delay
Identify missing records, deviations, investigations, or review bottlenecks.
Prioritize batches according to dispatch requirements without compromising quality decisions.
Urgent Customer Order
Check inventory first.
Check WIP.
Check materials.
Check capacity.
Evaluate impact on existing commitments.
Obtain approval before changing the frozen schedule.
Simple Recovery Flowchart
Problem Detected
↓
Does the problem affect safety, quality, or GMP compliance?
→ Yes: Stop or control the affected activity and involve QA according to procedure.
→ No: Continue operational assessment.
↓
Identify affected batches and customer orders
↓
Determine the root constraint
↓
Check material, equipment, manpower, QC, QA, and logistics options
↓
Create alternative production scenarios
↓
Evaluate impact on existing commitments
↓
Approve revised plan
↓
Communicate the new schedule
↓
Execute recovery actions
↓
Monitor until normal operation is restored
19. End-to-End Practical Case Study
Consider a tablet manufacturing facility producing five products.
| Product | Demand (M Tablets) | FG Inventory | Safety Stock | Batch Size (M) | Net Requirement | Batches |
|---|---|---|---|---|---|---|
| Alpha | 12 | 2 | 1 | 0.5 | 11 | 22 |
| Beta | 8 | 2 | 1 | 0.5 | 7 | 14 |
| Gamma | 6 | 1 | 0.5 | 0.25 | 5.5 | 22 |
| Delta | 10 | 3 | 1 | 1.0 | 8 | 8 |
| Epsilon | 5 | 1 | 0.5 | 0.5 | 4.5 | 9 |
Total required batches = 75.
Material Status
Alpha: All materials available.
Beta: API for four batches delayed until 10 July.
Gamma: All materials available.
Delta: Packing materials delayed until 15 July.
Epsilon: All materials available.
Equipment Capacity
Granulation available capacity = 80 batches.
Compression available capacity = 70 batch-equivalents.
Coating available capacity = 60 coated batches.
Packing available capacity = 65 batch-equivalents.
The exact comparison must use machine-hours or standardized units because batch durations differ.
For simplicity, assume the loading analysis shows:
Granulation = 85%.
Compression = 110%.
Coating = 90%.
Packing = 115%.
Therefore, compression and packing are constraints.
Manufacturing Times Per Batch
| Product | Granulation | Compression | Coating | Packing | QC | QA Release |
|---|---|---|---|---|---|---|
| Alpha | 8 hrs | 16 hrs | 10 hrs | 20 hrs | 72 hrs | 24 hrs |
| Beta | 10 hrs | 18 hrs | 12 hrs | 24 hrs | 72 hrs | 24 hrs |
| Gamma | 6 hrs | 10 hrs | 8 hrs | 16 hrs | 48 hrs | 24 hrs |
| Delta | 12 hrs | 24 hrs | 16 hrs | 30 hrs | 96 hrs | 24 hrs |
| Epsilon | 8 hrs | 14 hrs | 10 hrs | 18 hrs | 72 hrs | 24 hrs |
Delivery Dates
Alpha = 15 July.
Gamma = 18 July.
Beta = 22 July.
Epsilon = 25 July.
Delta = 30 July.
Maintenance Schedule
Compression Machine CT-02 unavailable from 8–10 July.
Packing Line BP-03 unavailable on 12 July.
Step 1: Calculate Net Requirements
Demand + Safety Stock − Finished Goods Inventory.
This determines the quantities requiring production.
Step 2: Convert Quantities into Batches
Round up when full validated batch sizes must be manufactured.
Step 3: Check Materials
Alpha, Gamma, and Epsilon are ready.
Part of Beta is delayed.
Delta cannot be packed before 15 July because packing material is unavailable.
Step 4: Check Capacity
Compression and packing are overloaded.
These departments require careful scheduling.
Step 5: Prioritize Products
A practical initial priority is:
Alpha.
Gamma.
Available Beta batches.
Epsilon.
Delta.
However, the planner must also consider existing WIP, campaign opportunities, equipment compatibility, and exact dispatch quantities.
Step 6: Sequence Production
Run consecutive batches where possible.
Avoid unnecessary product changes.
Schedule products requiring unavailable materials later.
Protect compression capacity during the CT-02 maintenance shutdown.
Avoid loading BP-03 immediately before its maintenance window if doing so creates stranded WIP.
Step 7: Monthly Plan
Approve only quantities supported by materials and finite capacity.
Flag Beta and Delta supply risks.
Create a recovery plan for compression and packing overload.
Step 8: Weekly Plan
Week 1:
Focus on Alpha and Gamma.
Start available Beta batches.
Week 2:
Complete Alpha and Gamma.
Resume Beta after material arrival.
Begin Epsilon.
Week 3:
Complete Beta and Epsilon.
Begin Delta packing after materials become available.
Week 4:
Complete Delta.
Use remaining capacity for recovery and approved inventory requirements.
Step 9: Daily Schedule
Create equipment-wise schedules.
Example:
CT-01: Alpha campaign.
CT-02: Gamma before maintenance, then Beta after maintenance.
CT-03: Gamma and Epsilon according to due dates.
Packing lines are scheduled according to downstream QC and dispatch priorities.
Step 10: Track Production
Every day compare:
Planned start vs. actual start.
Planned finish vs. actual finish.
Planned quantity vs. actual quantity.
Delay hours.
Delay reasons.
Recovery actions.
Step 11: Handle a Delay
Suppose CT-01 breaks down for 12 hours.
The planner:
Confirms estimated repair time.
Checks whether Alpha can run on another qualified machine.
Evaluates moving compatible batches.
Protects the 15 July Alpha commitment.
Updates the packing schedule.
Informs QC of revised sample arrival.
Updates QA and Supply Chain.
Creates a revised finite-capacity schedule.
Step 12: Create Recovery Plan
Possible actions:
Move qualified Alpha batches to CT-03.
Run Gamma after Alpha if due-date protection requires it.
Use approved overtime on packing lines.
Reduce unnecessary changeovers.
Prioritize QC testing based on dispatch risk.
Reserve QA review capacity for critical batches.
Step 13: Ensure On-Time Dispatch
The planner creates a dispatch readiness board containing:
Product.
Order quantity.
Finished goods available.
Manufacturing status.
Packing status.
QC status.
QA release status.
Dispatch date.
Risk.
Action owner.
This connects production activity directly to customer delivery.
20. Beginner’s Production Planning Checklist
Before finalizing the plan, check the following:
- Demand and confirmed orders reviewed.
- Delivery dates confirmed.
- Finished goods inventory checked.
- WIP checked.
- Safety stock requirements considered.
- Batch requirements calculated correctly.
- Approved raw materials available.
- Packing materials available.
- Material release dates confirmed.
- Equipment compatibility checked.
- Equipment capacity calculated.
- Maintenance schedule included.
- Cleaning time included.
- Changeover time included.
- Manpower availability checked.
- Manufacturing lead times considered.
- QC testing capacity checked.
- QA release time considered.
- Campaign opportunities evaluated.
- Cross-contamination controls respected.
- Bottleneck equipment identified.
- Monthly plan checked against finite capacity.
- Weekly loading balanced.
- Daily schedule prepared.
- Production priorities communicated.
- Plan vs. actual tracking established.
- Recovery actions defined for major risks.
- Dispatch dates protected.
- GMP requirements maintained.
- Plan approved and communicated.
21. Common Production Planning Mistakes
- Planning directly from gross demand.
Always check inventory, WIP, and safety stock first.
- Ignoring material status.
Physical stock does not always mean usable stock.
- Using theoretical machine capacity.
Deduct maintenance, cleaning, changeovers, and realistic downtime.
- Ignoring QC testing time.
Manufacturing completion is not dispatch readiness.
- Ignoring QA release time.
A packed batch cannot be dispatched until appropriately released.
- Overloading bottleneck equipment.
The result is excess WIP and delayed orders.
- Too many product changeovers.
Poor sequencing wastes capacity.
- Ignoring preventive maintenance.
The schedule becomes unrealistic.
- Planning without manpower checks.
Available machines still require trained employees.
- Changing the schedule too frequently.
Constant schedule changes create confusion and instability.
- Not freezing the short-term schedule.
A reasonable frozen planning window improves execution discipline.
- Ignoring existing WIP.
This can create unnecessary production and excess inventory.
- Failing to connect production to dispatch dates.
The purpose of planning is reliable supply, not simply machine utilization.
- Ignoring QC and QA capacity.
Laboratory and release backlogs can become major supply constraints.
- No recovery plan.
Every critical production plan should identify major risks and alternatives.
- Using inconsistent master data.
Incorrect batch sizes, cycle times, yields, or routing data create incorrect plans.
- Optimizing one department only.
Maximum granulation output is useless if compression or packing cannot process the WIP.
- Ignoring GMP for productivity.
Production targets never justify bypassing procedures, line clearance, cleaning, documentation, data integrity, or quality decisions.
22. Ten Golden Rules of Pharmaceutical Production Planning
Rule 1: Start with demand, but always subtract usable inventory and WIP.
Rule 2: Never schedule a batch without checking approved material availability.
Rule 3: Plan using realistic available capacity, not theoretical capacity.
Rule 4: Identify and protect the bottleneck.
Rule 5: Include cleaning, changeovers, maintenance, QC testing, and QA release in the schedule.
Rule 6: Sequence products intelligently, but never compromise GMP or contamination control.
Rule 7: Convert the monthly plan into weekly and daily executable schedules.
Rule 8: Measure plan vs. actual every day and act quickly on deviations.
Rule 9: Every delay must have an action, owner, and target completion time.
Rule 10: A production plan is successful only when the correct product is manufactured, tested, released, and delivered on time, in full, and in compliance with GMP requirements.
Conclusion
Pharmaceutical production planning is not simply preparing an Excel sheet containing batch numbers.
It is the process of connecting customer demand with inventory, materials, people, machines, manufacturing capacity, quality testing, batch release, and dispatch commitments.
A beginner should remember the complete planning logic:
Understand Demand
↓
Check Inventory and WIP
↓
Calculate Net Requirements
↓
Convert Requirements into Batches
↓
Check Approved Materials
↓
Calculate Available Capacity
↓
Calculate Manufacturing and Release Lead Times
↓
Identify Bottlenecks
↓
Prioritize and Sequence Products
↓
Prepare Monthly Production Plan
↓
Convert Monthly Plan into Weekly Plan
↓
Convert Weekly Plan into Daily Schedule
↓
Execute Under GMP Controls
↓
Track Plan vs. Actual
↓
Identify Delays and Constraints
↓
Create and Execute Recovery Actions
↓
Complete QC Testing and QA Release
↓
Dispatch the Correct Product On Time and In Full
The most important lesson is simple:
A good production plan must be realistic, capacity-feasible, material-feasible, quality-compliant, time-bound, measurable, and directly connected to customer delivery.
About the Author
Ramesh Palav is a pharmaceutical professional with 21+ years of experience in manufacturing, qualification, validation, CSV, GMP, and quality compliance. He shares practical industry insights on pharmaceutical manufacturing, GxP compliance, digital transformation, and Pharma 4.0 through Pharma Manufacturing Hub.