
By Ramesh Palav | Pharma Manufacturing Hub | Pharmaceutical Manufacturing, GMP & Operational Excellence.
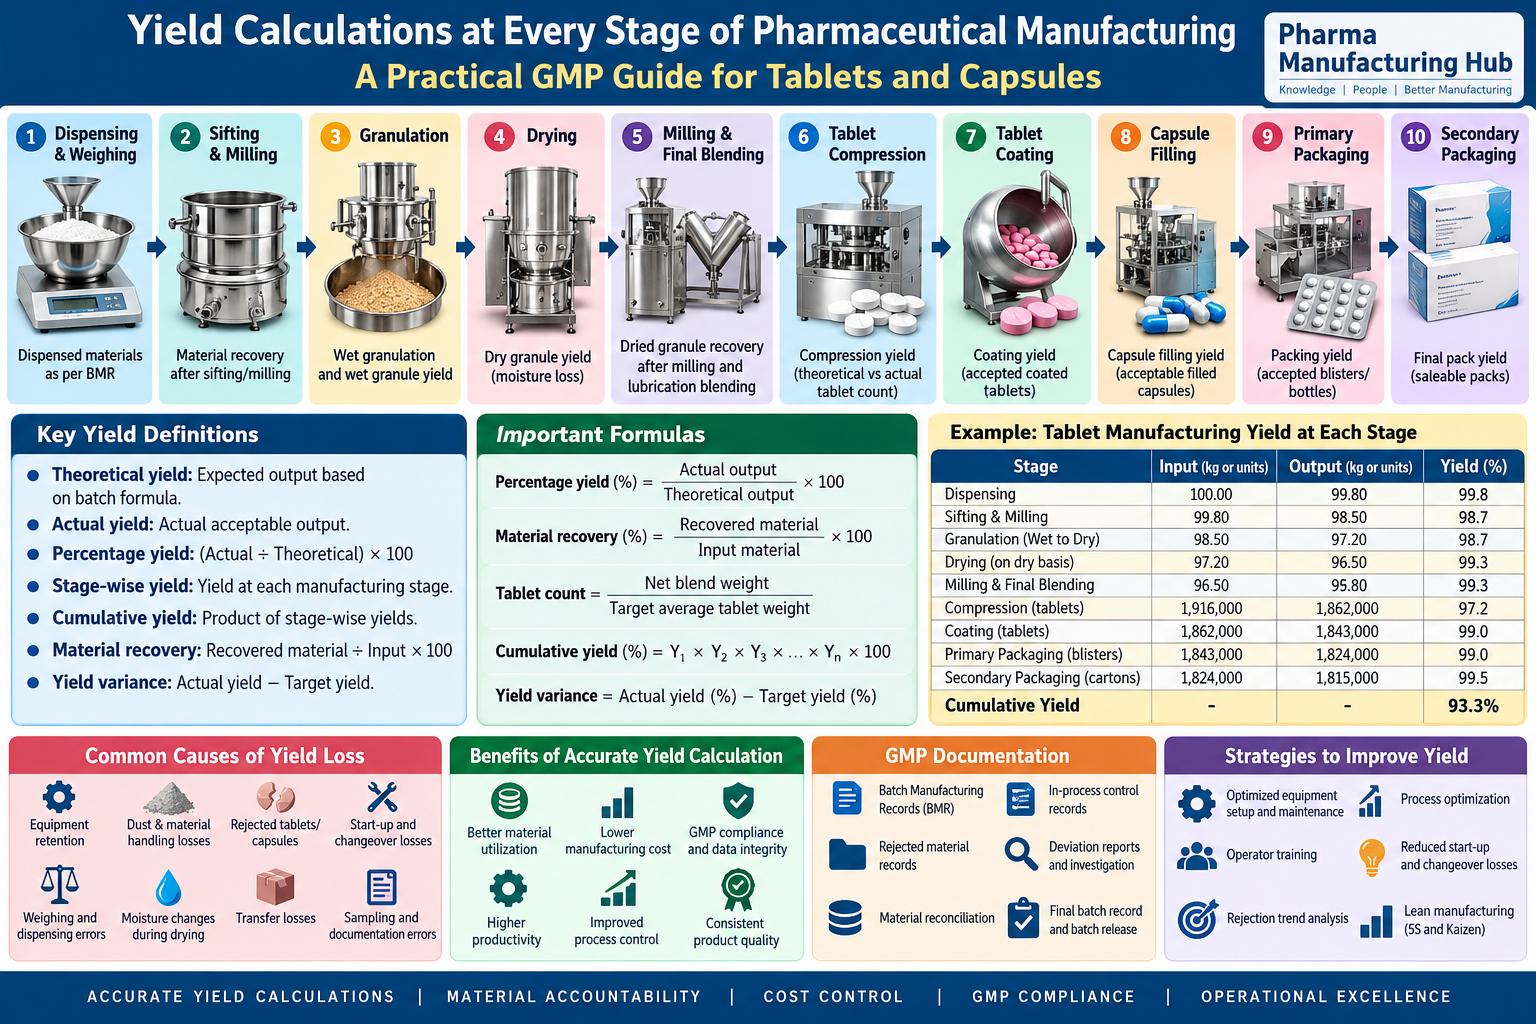
Yield calculation is one of the most useful tools for understanding how efficiently a pharmaceutical batch moves through manufacturing. It helps production teams identify material losses, evaluate process performance, reconcile quantities, and investigate unexpected differences before they become recurring problems.
In oral solid dosage (OSD) manufacturing, however, yield is not simply a matter of dividing the final quantity by the initial quantity. The calculation changes depending on the process stage, the measurement unit, moisture changes, rejected units, samples, and the definition of acceptable output.
For example, a reduction in granule weight during drying may result primarily from moisture removal, while a reduction in tablet count after compression may reflect rejected tablets, sampling, breakage, or other documented dispositions. Treating both situations as the same type of yield loss can lead to incorrect conclusions.
This practical guide explains how to calculate and interpret yield at each major stage of tablet and capsule manufacturing, with worked examples, GMP documentation considerations, and methods for improving manufacturing performance.
Important: All batch quantities and target yields used in this article are illustrative examples for training. Actual yield limits, calculation methods, material dispositions, and reconciliation requirements must follow approved product-specific documentation and applicable GMP requirements.
1. What Is Yield in Pharmaceutical Manufacturing?
Yield is the quantity of usable or eligible product obtained from a manufacturing operation compared with a defined expected quantity or input quantity.
Depending on the stage, yield may be measured in kilograms, grams, tablets, capsules, blister strips, bottles, or finished packs.
The purpose of yield monitoring is to answer three practical questions:
- How much material or product entered the process?
- How much acceptable output was obtained?
- What happened to the difference?
Yield monitoring supports production planning, material accountability, cost control, process improvement, and investigation of unexpected losses. It also helps manufacturing teams understand whether a process is performing consistently within its approved operating conditions.
Yield, output, productivity, and reconciliation: what is the difference?
| Term | Meaning | Example |
|---|---|---|
| Yield | Output relative to a defined expected or input quantity | 97,000 acceptable tablets from 100,000 eligible tablets |
| Output | The quantity actually produced | 97,000 acceptable tablets |
| Productivity | Output relative to time, labour, equipment capacity, or another resource | 20,000 tablets per hour |
| Material recovery | Quantity of material recovered relative to material input | 48 kg recovered from 50 kg processed |
| Reconciliation | Accounting for issued, used, recovered, rejected, sampled, and remaining quantities as applicable | Explaining the disposition of bulk tablets issued to packaging |
These measures complement one another but are not interchangeable. A batch may have a high yield and poor productivity because of extended downtime. Likewise, a process may have a lower yield but fully account for every rejected tablet and every quantity of material retained or discarded.
The objective is not simply to achieve the highest possible percentage. It is to achieve consistent, explainable process performance while meeting product quality and GMP requirements.
2. Types of Yield Calculations Used in Pharmaceutical Manufacturing
Before calculating yield at individual stages, the production team must define what is being measured and which quantities belong in the calculation.
2.1 Theoretical yield
Theoretical yield is the expected quantity calculated from the approved batch formula, process requirements, and relevant product specifications, assuming the defined calculation basis is met.
For tablet compression, theoretical tablet count may be calculated from the eligible blend quantity and the target average tablet weight.
Example
- Eligible blend quantity: 48 kg
- Target average tablet weight: 400 mg, or 0.4 g
Theoretical tablet count =48,000 g / 0.4 g tablet =120,000 tablets
This is a calculated count, not a guarantee that 120,000 acceptable tablets will be produced.
2.2 Actual yield
Actual yield is the quantity obtained and recorded after the operation. For performance calculations, distinguish the gross output from the acceptable output.
For example, if compression produces 118,500 tablets, including 1,500 rejected tablets, the acceptable output is 117,000 tablets before considering any separately documented samples or other dispositions.
2.3 Percentage yield
Percentage yield expresses actual output as a percentage of the defined theoretical or eligible output.
Yield % = Actual eligible output /Defined expected output x 100
If 117,000 acceptable tablets are obtained from a theoretical count of 120,000 tablets:
Yield=117,000 / 120,000 x 100 =97.5%
The denominator must be clearly defined. If an approved procedure allows specific documented quantities to be excluded from the comparison, the calculation must follow that procedure rather than an informal adjustment.
2.4 Stage-wise yield
Stage-wise yield measures performance at one manufacturing stage.
Examples include:
- Granulation recovery based on a defined material basis.
- Dried granule recovery after correcting for moisture changes.
- Compression yield based on tablet counts.
- Coating yield based on accepted coated tablets.
- Packaging yield based on eligible product entering the packaging operation and acceptable output.
2.5 Cumulative manufacturing yield
Cumulative yield estimates the combined yield across sequential stages when the stage percentages represent compatible quantities and each denominator corresponds to the preceding stage’s output.
If three consecutive stages achieve yields of 98%, 97%, and 99% on a compatible basis:
0.98 x 0.97 x 0.99 x 100 =94.11%
In a real OSD process, stages may use kilograms, tablet counts, and finished packs. Their percentages cannot automatically be multiplied unless their bases and boundaries are compatible.
2.6 Standard or expected yield
The expected yield is the product- and process-specific quantity or range established in approved documentation using appropriate process knowledge, development data, manufacturing experience, and other relevant evidence.
An expected yield is not a universal percentage applicable to all products. Granulation, compression, coating, and packaging have different loss mechanisms and measurement requirements.
2.7 Yield variance against target
Yield variance expresses the difference between actual yield and target yield in percentage points.
Suppose:
- Target yield = 98.0%
- Actual yield = 97.5%
Variance=97.5-98.0 =-0.5 percentage points
The negative sign indicates that actual yield is below target. Whether this requires an investigation depends on approved limits, the nature of the discrepancy, and the applicable procedure.
3. Yield Calculation at Every Stage of Pharmaceutical Manufacturing
The following sections explain the principal calculations for an OSD manufacturing process. Not every product follows the same sequence. For example, direct-compression tablets may not require granulation or drying, while capsules follow a filling process rather than tablet compression and coating.
Stage 1: Dispensing and weighing

shanghai-marya.en.made-in-china.com
Dispensing is the starting point for material accountability. The purpose is to issue the correct identity and quantity of each ingredient according to the approved batch formula.
Dispensing accuracy is different from manufacturing yield. A dispensing operation may meet its weighing tolerance even though the subsequent manufacturing process experiences material loss.
Example
The approved batch requirement for an excipient is 25.000 kg. The recorded dispensed quantity is 24.980 kg.
Dispensing variance =24.980-25.000=-0.020 kg
Relative variance (%)} =-0.020 / 25.000 x 100 =-0.08%
The dispensing record must be assessed against the applicable approved weighing tolerance and batch requirements. The difference must not be silently corrected by changing the recorded target or adding material without authorization.
Typical sources of discrepancy
- Balance or weighing errors.
- Material spillage during transfer.
- Incorrect tare weight.
- Incorrect material identification or quantity entry.
- Residual material in dispensing containers.
- Transcription or unit-conversion errors.
GMP records and controls
Review material issue and dispensing records, balance identification and status, actual weights, applicable verification checks, material labels, and any documented discrepancies. Investigate unexpected differences according to the relevant procedure.
Stage 2: Sifting and milling
Sifting and milling prepare raw materials or intermediate blends for further processing. Material may remain on screens, collect in dust extraction systems, or be retained in transfer equipment.
Formula
Material recovery (%) = Recovered material / Material input x 100
Worked example
- Material entering sifting: 50.00 kg
- Recovered material meeting the applicable criteria: 49.40 kg
Recovery = 49.40 / 50.00 x 100 = 98.8%
The difference is 0.60 kg, but it should not automatically be described as unexplained process loss. The team must establish whether it represents documented sampling, material retained in equipment, collected dust, rejected oversize material, spillage, or an unresolved discrepancy.
Recovered dust or oversize material must not automatically be returned to the batch. Its disposition depends on the approved procedure and material-quality assessment.
Investigation focus
Check sieve integrity, equipment assembly, screen retention, dust collection, transfer practices, equipment cleaning records, and the actual disposition of recovered or rejected material.
Stage 3: Granulation
Granulation converts a powder blend into granules with suitable properties for downstream processing. Depending on the process, this may involve dry granulation, wet granulation, or another approved technique.
For wet granulation, the weight of the wet mass includes added liquid. Consequently, wet mass weight cannot be compared directly with the dry powder input to determine manufacturing recovery.
For a meaningful dry-basis comparison, the relevant quantities must be expressed on a consistent basis.
Illustrative example
- Dry powder blend input: 50.00 kg
- Dry solids recovered after granulation and subsequent drying, on a defined consistent basis: 49.50 kg
Dry-basis recovery = 49.50 / 50.00 x 100 = 99.0%
This calculation is valid only if the recovered quantity has been corrected appropriately for moisture and other relevant additions or removals. If the input contains a different moisture level, or if process additions change the solids basis, further adjustments are required.
Common loss mechanisms
- Powder retained in the granulator or transfer containers.
- Binder solution left in the preparation vessel or transfer lines.
- Material spillage during charging and discharge.
- Dust collection.
- Sampling and documented rejects.
- Incomplete transfer of wet mass.
GMP controls
Review the batch record, ingredient quantities, binder preparation and transfer records, equipment discharge checks, sampling quantities, and any abnormal material retention or loss.
Stage 4: Drying and loss on drying (LOD)
Drying is one of the stages where a simple weight-based yield calculation can be misleading. The granule weight normally decreases as water or other volatile components are removed.
That decrease is not necessarily a loss of active ingredient or dry solids.
LOD is a measurement of mass loss under the specified test conditions. It is not automatically identical to water content because other volatile substances may contribute to the measured loss.
Illustrative example
- Wet granule mass: 60.00 kg
- Measured LOD before drying: 15.0%
- Measured LOD after drying: 2.0%
- Assumption: the relevant mass change is attributable to the measured LOD, with no other additions or material losses.
The estimated dry solids at the start are:
60.00 x {1-0.15)=51.00 kg
The theoretical final mass at 2.0% LOD, assuming the same dry solids are retained, is:
Expected final mass = 51.00 / {1-0.02} = 52.041 kg
Therefore, a reduction from 60.00 kg to approximately 52.04 kg is consistent with moisture reduction under these assumptions. It should not be classified as an 13.27% loss of dry solids.
If the measured final quantity is materially lower than the moisture-adjusted expectation, investigate the difference using the approved procedures.
Drying controls
- Review LOD results and sampling records.
- Verify the drying time, temperature, and other approved process parameters.
- Check for granule loss during unloading and transfer.
- Review equipment retention and dust collection.
- Compare mass quantities on a consistent moisture basis.
Stage 5: Milling and final blending
After drying, granules may be milled, screened, and blended with additional excipients or lubricant. Because additional ingredients may be added at this stage, the total output should not be compared with the original granule quantity without adjusting the material basis.
Worked example
- Dried granules entering milling: 52.04 kg
- Recovered milled granules: 51.80 kg
Milling recovery = 51.80 / 52.04 x 100 Approx 99.54
Suppose 0.40 kg of an approved additional ingredient is then added. The theoretical blend quantity before other defined losses is 52.20 kg, not 51.80 kg.
If the final eligible blend quantity is 52.05 kg:
Blend recovery = 52.05 / 52.20 x 100 approx 99.71%
The second calculation uses the combined blend input and must be adjusted if any other additions, samples, or documented dispositions apply.
Typical losses
- Granules retained in the mill or blender.
- Dust extraction and material spillage.
- Material retained in transfer containers.
- Sampling and rejected material.
- Incomplete discharge from equipment.
Document the quantities and their dispositions. Avoid adding ingredient quantities to a denominator twice when calculating a combined stage yield.
Stage 6: Tablet compression

Compression converts the eligible lubricated blend into tablet cores. Yield is commonly assessed using tablet counts, but the definition of acceptable output and the treatment of samples and rejects must be established in the applicable batch documentation.
Formula
\[ \text{Compression yield (\%)} =\frac{\text{Actual eligible tablet count}} {\text{Theoretical tablet count}}\times100 \]
The theoretical tablet count can be estimated from the eligible blend quantity and target average tablet weight, provided the blend and tablet-weight bases are appropriate.
Worked example
- Eligible blend quantity: 48.00 kg
- Target average tablet weight: 400 mg
- Total tablets produced: 118,500
- Rejected tablets: 1,500
- Acceptable tablets: 117,000
Theoretical tablet count:
\[ \frac{48,000\text{ g}}{0.400\text{ g/tablet}} =120,000\text{ tablets} \]
Compression yield:
\[ \frac{117,000}{120,000}\times100 =\boxed{97.5\%} \]
This example assumes the defined theoretical count is the correct denominator for the operation. If the approved calculation method accounts separately for documented samples or other dispositions, apply that method consistently.
Common reasons for compression yield loss
- Start-up and machine-setting rejects.
- Tablet sticking or picking.
- Capping and lamination.
- Chipped, broken, or otherwise defective tablets.
- Excessive weight variation leading to rejection.
- Deduster or transfer losses.
- Powder retention in the hopper, feed frame, or equipment.
Practical controls
Monitor in-process tablet weight and other specified quality attributes. Trend rejects by defect type, machine, tooling set, product, and shift where appropriate. Review the actual count of acceptable tablets, rejected tablets, samples, and remaining blend.
A high compression yield does not override an out-of-specification result or an unresolved quality concern.
Stage 7: Tablet coating

Coating applies a defined coating formulation to tablet cores to achieve the intended product attributes. Tablet mass normally increases as coating material is deposited.
For this reason, coating-stage yield should usually be assessed using accepted tablet counts when the core count is traceable, or by using a clearly defined mass balance where appropriate.
Worked example
- Accepted tablet cores entering coating: 117,000
- Accepted coated tablets: 115,800
- Rejected coated tablets: 900
- Other 300 cores accounted for as documented samples or another authorized disposition, assumed for this example
If the denominator is the 117,000 cores entering coating:
\[ \text{Coating yield} =\frac{115,800}{117,000}\times100 \approx\boxed{98.97\%} \]
The 1,200-unit difference between input and accepted output is fully accounted for in this illustrative example. It should not be labelled entirely as physical loss because some units have documented dispositions.
If the coating formulation increases tablet weight by 3%, the mass of accepted coated tablets may be greater than the mass of their corresponding cores. That increase represents deposited coating material, not additional tablet units.
Common loss mechanisms
- Tablet chipping or breakage.
- Tablet-to-tablet sticking.
- Excessive or uneven coating defects.
- Damage during unloading and transfer.
- Rejected tablets and samples.
- Tablet retention in the coating pan or discharge equipment.
Review coating parameters, tablet handling, pan loading, spray performance, drying conditions, and documented reject quantities. Any process adjustment must follow approved procedures and applicable validated or qualified conditions.
Stage 8: Capsule filling
Capsule filling converts an eligible powder or granule blend into filled capsules using suitable capsule shells. The calculation should distinguish filled-capsule count yield from powder recovery.
Worked example
- Theoretical eligible capsule count: 100,000
- Total capsules produced: 98,500
- Rejected capsules: 1,000
- Acceptable filled capsules: 97,500
\[ \text{Capsule filling yield} =\frac{97,500}{100,000}\times100 =\boxed{97.5\%} \]
This is a count-based yield. Powder recovery requires a separate calculation using the actual powder input, powder incorporated into acceptable capsules, and other documented quantities.
Potential causes of loss
- Capsule-shell damage.
- Empty or partially filled capsules.
- Fill-weight variation.
- Powder spillage or dust collection.
- Start-up rejects.
- Equipment retention and sampling.
Check the approved in-process controls, capsule and powder reconciliation, reject records, and filling-machine performance. Do not use capsule count alone to conclude that all powder has been reconciled.
Stage 9: Primary packaging
Primary packaging places tablets or capsules into their immediate packaging, such as blister strips or bottles. Packaging yield is not necessarily the same as manufacturing yield because product can be consumed during machine trials, rejected in defective packs, or retained as unfilled bulk product.
Worked example: blister packaging
Assume the following:
- Eligible tablets issued to packaging: 115,800
- Tablets contained in accepted blister packs: 112,000
- Tablets in rejected blister packs: 1,200
- Tablets used in documented samples and line trials: 400
- Tablets remaining as reconciled bulk product: 2,200
The quantity accounted for is:
\[ 112,000+1,200+400+2,200=115,800 \]
The accepted-product yield on the tablet-count basis is:
\[ \frac{112,000}{115,800}\times100 \approx\boxed{96.72\%} \]
The remaining 3.28% must not automatically be treated as unexplained loss. The example accounts for it through rejects, samples and trials, and remaining bulk product.
For a 10-tablet blister format, 112,000 accepted tablets represent 11,200 accepted blister packs, assuming every accepted blister contains exactly 10 tablets.
Packaging checks
- Reconcile bulk product issued, packed, rejected, sampled, and remaining.
- Verify the number of tablets per blister or bottle.
- Review line-trial and start-up consumption records.
- Check defective blister, seal, print, and coding rejects as applicable.
- Verify that product and packaging component counts are consistent.
If rejected blisters are subsequently opened and tablets recovered, their disposition and any reprocessing or recovery must follow approved procedures. The same tablets must not be counted twice.
Stage 10: Secondary packaging and finished goods
Secondary packaging includes operations such as carton packing, leaflet insertion, serialization, aggregation where applicable, and final case packing.
The most useful output measure is often the number of accepted saleable packs, compared with the eligible pack quantity entering the operation or the defined theoretical batch output.
Worked example
- Eligible blister packs entering secondary packaging: 11,200
- Accepted finished packs: 11,050
- Rejected cartons or packs: 100
- Documented samples and retained packs: 20
- Packs remaining in a reconciled, approved status: 30
\[ 11,050+100+20+30=11,200 \]
The accepted finished-pack yield is:
\[ \frac{11,050}{11,200}\times100 \approx\boxed{98.66\%} \]
The example demonstrates quantity reconciliation, not automatic batch approval. Rejected packs must be properly accounted for, and retained packs must have a documented status and disposition.
Common causes of secondary-packaging losses
- Carton damage or incorrect printing.
- Leaflet insertion problems.
- Coding and serialization rejects.
- Line-clearance and start-up losses.
- Damaged or incomplete packs.
- Count discrepancies during packing.
Final reconciliation must follow approved procedures. The batch may be released only after the required quality review and other applicable release requirements have been met.
4. Essential Yield Calculation Formulas
The following formulas are commonly useful in pharmaceutical manufacturing. Before applying any formula, define the measurement basis, units, eligible quantities, and treatment of samples, rejects, and remaining material.
Quick reference: Yield calculations
1. Percentage yield
\[ \frac{\text{Actual eligible output}} {\text{Defined expected output}}\times100 \]
Use when actual and expected output are measured on a comparable basis.
2. Material recovery
\[ \frac{\text{Recovered material quantity}} {\text{Material input quantity}}\times100 \]
Use with consistent mass, moisture, and material-composition bases.
3. Theoretical tablet count
\[ \frac{\text{Eligible blend mass (g)}} {\text{Target tablet weight (g/tablet)}} \]
Assumes the blend quantity and target tablet weight are appropriate for the defined calculation.
4. Yield variance
\[ \text{Actual yield (\%)}-\text{Target yield (\%)} \]
Report the difference in percentage points.
5. Cumulative yield
\[ \left(\prod_{i=1}^{n}\frac{Y_i}{100}\right)\times100 \]
Valid when the sequential stage yields have compatible definitions and denominators.
6. Material balance
\[ \begin{aligned} \text{Input}={}&\text{Accepted output}\\ &+\text{Rejects}+\text{Samples}\\ &+\text{Remaining material}\\ &+\text{Other documented dispositions}\\ &+\text{Unexplained difference} \end{aligned} \]
All terms must use a consistent quantity basis, and the categories must not overlap.
Additional useful calculations
Material loss percentage
Where input and recovered output are measured on the same basis:
\[ \text{Loss (\%)}= \frac{\text{Input}-\text{Recovered output}} {\text{Input}}\times100 \]
This is an apparent unrecovered fraction until the disposition of the difference has been established. It should not automatically be called physical loss.
Tablet weight conversion
If target tablet weight is stated in milligrams:
\[ \text{Tablet count}= \frac{\text{Blend mass (g)}\times1,000} {\text{Target weight (mg/tablet)}} \]
For example, 40 kg of eligible blend at a target tablet weight of 500 mg gives:
\[ \frac{40,000,000\text{ mg}}{500\text{ mg/tablet}} =80,000\text{ tablets} \]
This theoretical count does not replace the actual compression count or the required quality checks.
Yield variance example
If actual yield is 98.4% and the approved target is 99.0%, the variance is −0.6 percentage points. If the target is expressed as a range, compare actual performance against the applicable approved criteria rather than relying on the target alone.
5. Complete Worked Example: From Granulation to Finished Packs
The following example demonstrates how yield and reconciliation can be tracked across an illustrative tablet batch. It uses separate material and unit-count bases where required; the numbers are not universal manufacturing benchmarks.
Batch assumptions
- Product: hypothetical immediate-release tablet.
- Target core tablet weight: 400 mg.
- Eligible blend quantity entering compression: 48.00 kg.
- Theoretical compression output: 120,000 tablets.
- Primary packaging format: 10 tablets per blister.
- All quantities are illustrative, and recorded samples, rejects, and retained product have defined dispositions.
Stage-wise calculation table
| Stage | Input | Output or disposition | Calculated result |
|---|---|---|---|
| Granulation, dry-solids basis | 50.00 kg | 49.50 kg recovered dry solids | 99.00% recovery |
| Drying | 60.00 kg wet granules at 15% LOD | 52.04 kg expected at 2% LOD | Moisture-adjusted mass balance |
| Milling and blending | 52.20 kg combined blend inputs | 52.05 kg eligible blend | 99.71% recovery |
| Compression | 120,000 theoretical tablets | 117,000 acceptable tablets | 97.50% yield |
| Coating | 117,000 core tablets | 115,800 accepted coated tablets | 98.97% yield |
| Primary packaging | 115,800 tablets issued | 112,000 tablets in accepted blister packs | 96.72% accepted-product yield |
| Secondary packaging | 11,200 eligible blister packs | 11,050 accepted finished packs | 98.66% accepted-pack yield |
Important interpretation: The granulation and drying figures use a material-mass basis, while later stages use unit counts. The table illustrates how stage results are documented; it does not mean every percentage can be multiplied into a single batch yield.
The drying result is a calculated expectation based on LOD, not proof of actual recovered output. Actual drying performance must be assessed using the recorded output mass and relevant material balance.
Reconciliation of compression output
Suppose the compression record contains:
| Quantity | Tablets |
|---|---|
| Theoretical tablet count | 120,000 |
| Acceptable tablets produced | 117,000 |
| Rejected tablets | 1,500 |
| Other documented dispositions or remaining quantity | 1,500 |
| Total accounted for against the theoretical count | 120,000 |
This simplified reconciliation is illustrative. In an actual batch, the production record must establish whether the remaining 1,500 units represent samples, other documented dispositions, material still awaiting reconciliation, or an actual discrepancy. They must not be assigned an assumed status merely to make the arithmetic balance.
Reconciliation of primary packaging output
| Quantity | Tablets |
|---|---|
| Bulk tablets issued to packaging | 115,800 |
| Tablets in accepted blister packs | 112,000 |
| Tablets in rejected blister packs | 1,200 |
| Documented samples and line-trial consumption | 400 |
| Reconciled remaining bulk tablets | 2,200 |
| Total accounted for | 115,800 |
The accepted blister-pack count is 11,200, assuming 10 tablets in each accepted blister. The accepted-product yield is 96.72% on the tablet-count basis.
The 1,200 tablets in rejected blister packs must be assigned a documented disposition. If the blisters are opened and tablets are recovered, the recovery and subsequent use must be authorized, documented, and handled under the approved procedure.
Final pack reconciliation
| Quantity | Packs |
|---|---|
| Eligible blister packs entering secondary packaging | 11,200 |
| Accepted finished packs | 11,050 |
| Rejected packs | 100 |
| Documented samples or retained packs | 20 |
| Remaining packs in a reconciled status | 30 |
| Total accounted for | 11,200 |
Final accepted-pack yield:
\[ \frac{11,050}{11,200}\times100 =\boxed{98.66\%} \]
The result tells the production team how many eligible blister packs became accepted finished packs. It does not, by itself, establish the overall batch yield from raw materials or demonstrate that the batch is suitable for release.
6. Cumulative Yield Calculation: How to Calculate It Correctly
Cumulative yield is useful for evaluating the combined effect of consecutive process stages. However, it must be applied only when the stages are mathematically compatible.
Example of cumulative yield on a consistent basis
Assume three sequential operations have the following yields, all measured on a compatible unit-count basis:
- Stage A: 98.0%
- Stage B: 97.0%
- Stage C: 99.0%
The combined yield is:
\[ \begin{aligned} Y_c&=0.98\times0.97\times0.99\times100\\ &=\boxed{94.11\%} \end{aligned} \]
If the initial eligible quantity is 100,000 units, the corresponding output is approximately 94,109 units before any rounding required by the defined counting method.
Adding the three percentages would produce 294%, which has no meaningful interpretation as cumulative yield.
Why different manufacturing stages need special treatment
Consider a typical OSD process:
- Granulation is measured in kilograms of material.
- Drying changes the mass because moisture is removed.
- Compression produces tablet counts.
- Coating adds mass while potentially reducing the acceptable tablet count.
- Packaging converts tablets into blister strips or bottles.
- Secondary packaging converts eligible packs into finished saleable units.
These are not automatically comparable denominators. A physically meaningful end-to-end yield calculation must use a consistent basis, such as equivalent units derived from a defined batch formula and product-specific mass balance, with adjustments for formulation additions, moisture changes, samples, rejects, and other documented dispositions.
For management reporting, it may be more useful to track the individual stage yields separately and calculate final saleable-pack yield against the defined eligible output than to multiply every recorded percentage into a single number.
Practical rule: Never multiply stage-wise yields simply because they appear in the same batch record. First confirm that each stage’s output is the next stage’s corresponding input and that no quantity is double-counted or omitted.
7. GMP Documentation and Batch Manufacturing Records
Yield calculations are meaningful only when supported by accurate, traceable manufacturing records. A numerical result without a reliable record of input, output, rejects, samples, and remaining material does not provide sufficient evidence of material accountability.
Records to review during yield assessment
| Record | What to verify |
|---|---|
| Batch Manufacturing Record (BMR) | Approved quantities, actual quantities, stage outputs, calculations, signatures, and required checks |
| Dispensing records | Material identity, batch or lot number, actual weight, balance identification, and verification |
| In-process control records | Recorded process results, rejects, samples, and relevant acceptance criteria |
| Equipment and transfer records | Equipment status, discharge checks, material retention, and transfer quantities where recorded |
| Rejected material records | Quantity, reason for rejection, identification, segregation, and disposition |
| Sampling records | Sample quantity, purpose, identification, and disposition |
| Packaging reconciliation | Bulk product issued, packed quantity, rejects, samples, and remaining product |
| Deviation and investigation records | Description of the discrepancy, investigation, impact assessment, root cause, and CAPA where applicable |
What should be documented when yield does not reconcile?
When a discrepancy is identified:
- Verify the original input and output quantities against source records.
- Check units, conversions, calculations, and transcription entries.
- Confirm whether samples, rejects, retained material, and other documented dispositions have been included correctly.
- Review equipment retention, transfers, and relevant process events.
- Document the actual findings and follow the approved discrepancy or deviation procedure.
- Assess potential implications for product quality, batch traceability, and data integrity.
- Record corrections, investigation conclusions, and CAPA in accordance with approved procedures.
Corrections to GMP records must preserve the original entry and provide the required traceability, justification, and authorization. Records must not be retrospectively altered merely to bring yield within an expected range.
A balanced material reconciliation is useful evidence, but it does not automatically prove that the manufacturing process was under control.
8. Yield Limits, Deviations, and Investigations
Yield limits should be established using relevant product and process knowledge, development and manufacturing data, appropriate process qualification or validation evidence, historical performance, and applicable requirements.
Different products and operations may have different expected yields. A yield target for one tablet product should not be applied automatically to another product with a different formulation, process, equipment configuration, or packaging format.
How to investigate a low or unexpected yield
Step 1: Verify the calculation
Recheck input quantities, output quantities, unit conversions, theoretical yield, and the applicable approved calculation method.
Step 2: Establish the material balance
Account for accepted product, rejects, samples, equipment retention, remaining material, and other documented dispositions. Identify any unresolved difference.
Step 3: Investigate potential causes
Review equipment condition, process parameters, operator practices, material handling, in-process results, reject trends, and relevant records.
Step 4: Assess impact and determine action
Evaluate product quality, batch traceability, and potential risks. Follow applicable deviation, investigation, disposition, and CAPA procedures.
Practical investigation examples
Case 1: Low granule recovery
The recovered granule quantity is lower than expected.
Potential checks include equipment retention, dust collection, transfer-container residues, spillage, sampling, and moisture-basis calculations. Compare measured quantities and documented dispositions before concluding that material has been physically lost.
Case 2: Low compression yield
Compression yield decreases compared with historical performance.
Review start-up rejects, tablet defects, weight variation, machine settings, tooling condition, deduster losses, and blend remaining in the equipment. Trend the reasons for rejection rather than relying only on the final percentage.
Case 3: Unexpected coating yield
The number of accepted coated tablets is lower than the number of eligible cores entering the coating process.
Check breakage, chipping, sticking, equipment retention, coating defects, and documented samples. Do not treat coating weight gain as a recovery of lost tablet units.
Case 4: Packaging reconciliation discrepancy
The number of tablets issued to packaging does not match the tablets in accepted packs, rejects, samples, and remaining bulk product.
Verify the pack format, machine-trial consumption, rejected blisters, product counts, and remaining stock. An unexplained difference requires appropriate investigation even when the overall manufacturing yield appears acceptable.
Root cause analysis and CAPA
Methods such as the 5-Why technique and fishbone analysis can help organize potential causes. The investigation should distinguish verified facts from hypotheses and identify evidence supporting the root cause.
CAPA should address the confirmed cause and include appropriate effectiveness checks. Repeatedly retraining operators without establishing why a problem occurred may not prevent recurrence.
Most importantly, a yield within the approved range does not justify ignoring an unexplained discrepancy. Material accountability, product quality, and record integrity must be assessed independently of the yield percentage.
9. Common Yield Calculation Mistakes
The following errors can produce misleading results even when the arithmetic appears correct.
| Common mistake | Why it is a problem | Better practice |
|---|---|---|
| Using the wrong theoretical quantity | Produces an incorrect denominator | Verify the approved batch formula and calculation basis |
| Mixing kilograms, grams, and milligrams | Causes conversion errors | Convert quantities to compatible units before calculation |
| Ignoring moisture changes | Misclassifies drying-related weight changes as material loss | Use an appropriate moisture-adjusted mass balance |
| Treating coating weight gain as yield improvement | Confuses mass increase with acceptable tablet count | Assess unit-count yield or a defined coating mass balance |
| Excluding rejects without documentation | Hides the true disposition of material | Record reject quantities and authorized disposition |
| Double-counting samples or losses | Distorts reconciliation | Use mutually exclusive, clearly defined categories |
| Confusing recovery with yield | Applies the wrong performance measure | Define the input, output, and purpose of the calculation |
| Using unapproved target limits | Creates an invalid comparison | Follow approved product- and process-specific criteria |
| Retrospectively adjusting BMR entries | Can compromise data integrity | Correct records through the approved traceable process |
| Multiplying incompatible stage percentages | Produces a misleading cumulative result | Confirm common measurement bases and sequential denominators |
One additional mistake is to regard high yield as proof of good quality. A process may produce more units but still have defects, inadequate in-process control, or unresolved quality concerns. Yield must always be interpreted alongside the applicable quality and compliance data.
10. Strategies to Improve Yield in Pharmaceutical Manufacturing
Yield improvement should start with identifying the dominant, measurable sources of loss. General measures such as increasing machine speed or reducing cleaning time may not address the actual cause and must never compromise product quality, contamination control, or approved process requirements.
Equipment setup and preventive maintenance
- Check equipment assembly and condition before processing.
- Verify screens, seals, transfer connections, tooling, and discharge mechanisms as applicable.
- Monitor equipment retention and investigate recurring residues.
- Maintain equipment in accordance with approved maintenance procedures.
Material transfer and handling
- Standardize charging, transfer, and discharge practices.
- Review container design, transfer paths, and dust extraction.
- Reduce avoidable spillage while maintaining appropriate containment.
- Document recovered material and ensure its disposition is authorized.
Compression and coating process optimization
- Trend rejects by defect type, equipment, product, and shift.
- Investigate recurrent sticking, picking, capping, lamination, and breakage.
- Review coating defects, handling damage, and unloading practices.
- Make changes only within approved process conditions and under the applicable change-control requirements.
Packaging performance
- Analyze start-up and line-trial consumption.
- Review blister sealing, product feeding, counting, coding, and rejection trends.
- Verify that rejected packs and remaining bulk product are reconciled.
- Reduce recurring setup-related losses through controlled standardization.
Operator training and standard work
Ensure that personnel understand the difference between acceptable output, rejects, samples, remaining material, and unexplained differences. Standardized work instructions and practical calculation training can reduce both operational errors and documentation mistakes.
Lean manufacturing, 5S, and Kaizen
Use 5S to maintain orderly work areas and reduce handling mistakes. Kaizen and other continuous-improvement methods can help identify avoidable losses, provided improvements are evidence-based and assessed through the applicable quality system.
Data-driven yield monitoring
Track stage-wise yield and loss reasons by batch, product, equipment, and time period. Review recurring patterns rather than focusing only on individual batch results.
For example, if compression yield falls repeatedly on a particular machine, comparing reject reasons and equipment-related events may reveal a common cause that is not apparent from the final percentage alone.
A sound improvement programme combines yield trends with reject rates, downtime, in-process quality, deviation trends, and reconciliation results.
11. Frequently Asked Questions (FAQs)
1. What is yield in pharmaceutical manufacturing?
Yield is the quantity of eligible output obtained relative to a defined expected or input quantity. Depending on the operation, it may be measured by mass, tablet count, capsule count, or finished-pack count.
2. How is tablet compression yield calculated?
Divide the actual eligible tablet count by the defined theoretical tablet count and multiply by 100.
For example, 117,000 acceptable tablets against a theoretical count of 120,000 gives a compression yield of 97.5%.
3. What is the difference between yield and recovery?
Yield generally measures output against a defined expected or input quantity, while material recovery measures how much material is recovered relative to the material entering the operation. The terms may be used differently in site procedures, so the approved definition must be followed.
4. How is yield calculated after drying?
Drying performance should be assessed using the recorded input and output quantities, moisture results, and applicable mass-balance calculations. A reduction in wet granule weight is not automatically a loss of dry solids.
5. How is tablet coating yield calculated when tablet weight increases?
Where the tablet cores can be counted reliably, compare the number of accepted coated tablets with the eligible core count entering coating. Coating-related weight gain must not be mistaken for additional tablet units.
6. How is cumulative batch yield calculated?
Multiply compatible sequential yield fractions and convert the result to a percentage. Before doing so, verify that each stage’s output corresponds to the next stage’s input and that the measurement bases are consistent.
7. What should be done if yield falls outside the approved limit?
Verify the calculation, reconcile the material, review source records, investigate the discrepancy under the approved procedure, and assess potential product-quality implications. Document the findings and implement CAPA where justified.
8. Is a high yield always an indication of good manufacturing performance?
No. High yield does not establish that the product meets specifications or that all material has been properly reconciled. Yield must be assessed together with quality results, reject trends, documentation, and process-control information.
9. How do you calculate theoretical tablet quantity from blend weight?
Convert the eligible blend mass into a unit consistent with the target tablet weight, then divide.
For 30 kg of eligible blend and a target tablet weight of 300 mg:
\[ \frac{30,000,000\text{ mg}}{300\text{ mg/tablet}} =100,000\text{ tablets} \]
This is a theoretical count under the stated assumptions, not the guaranteed number of acceptable tablets.
10. Why is material reconciliation important even when yield is within limits?
Reconciliation establishes what happened to the material. An unexplained difference may indicate a calculation error, undocumented disposition, process issue, or potential quality concern. A satisfactory yield percentage does not eliminate the need to investigate such differences.
11. What is the difference between percentage points and percentage change?
Percentage-point variance is the direct difference between two percentages. For example, 98% minus 97% equals 1 percentage point. Relative percentage change uses the original value as its denominator and gives a different result.
12. Can the same yield formula be used for every manufacturing stage?
No. Granulation and milling may use material recovery, drying requires consideration of moisture changes, compression and coating often use unit-count measures, and packaging uses product or pack reconciliation. The calculation must match the operation.
12. Conclusion
Yield calculation is much more than a final number recorded in a Batch Manufacturing Record. When performed correctly, it provides a practical understanding of material utilization, manufacturing efficiency, process consistency, and potential sources of loss.
For pharmaceutical tablet and capsule manufacturing, the most reliable approach is to establish a clear calculation basis at every stage, distinguish material recovery from unit-count yield, account for moisture changes, and reconcile rejects, samples, and remaining material.
Production teams should also review trends over time. A recurring loss during granulation, compression, coating, or packaging may provide an opportunity for targeted process improvement. However, improvements must be supported by evidence and remain within approved manufacturing and quality requirements.
Ultimately, effective yield management combines accurate calculations, complete GMP documentation, meaningful investigations, and sustained operational improvement. The objective is not simply to achieve a higher percentage, but to manufacture quality products consistently while maintaining full material accountability.
About the Author – Ramesh Palav
Ramesh Palav is a pharmaceutical manufacturing professional with over 21 years of experience in Oral Solid Dosage (OSD) manufacturing, production management, qualification, validation, and GMP compliance. His expertise includes tablet manufacturing processes such as granulation, compression, and coating, along with pharmaceutical quality systems, process optimization, and regulatory audit readiness.
Through Pharma Manufacturing Hub, Ramesh shares practical industry knowledge on pharmaceutical manufacturing excellence, yield calculations, material reconciliation, GMP documentation, process validation, root cause analysis, CAPA, data integrity, and operational excellence.
His goal is to help pharmaceutical professionals, Production Managers, QA professionals, supervisors, and aspiring industry professionals understand complex manufacturing concepts through practical examples, technical guidance, and shop-floor applications.
Ramesh believes that consistent product quality, accurate documentation, effective process control, and continuous improvement are essential for achieving sustainable manufacturing performance and maintaining GMP compliance.