
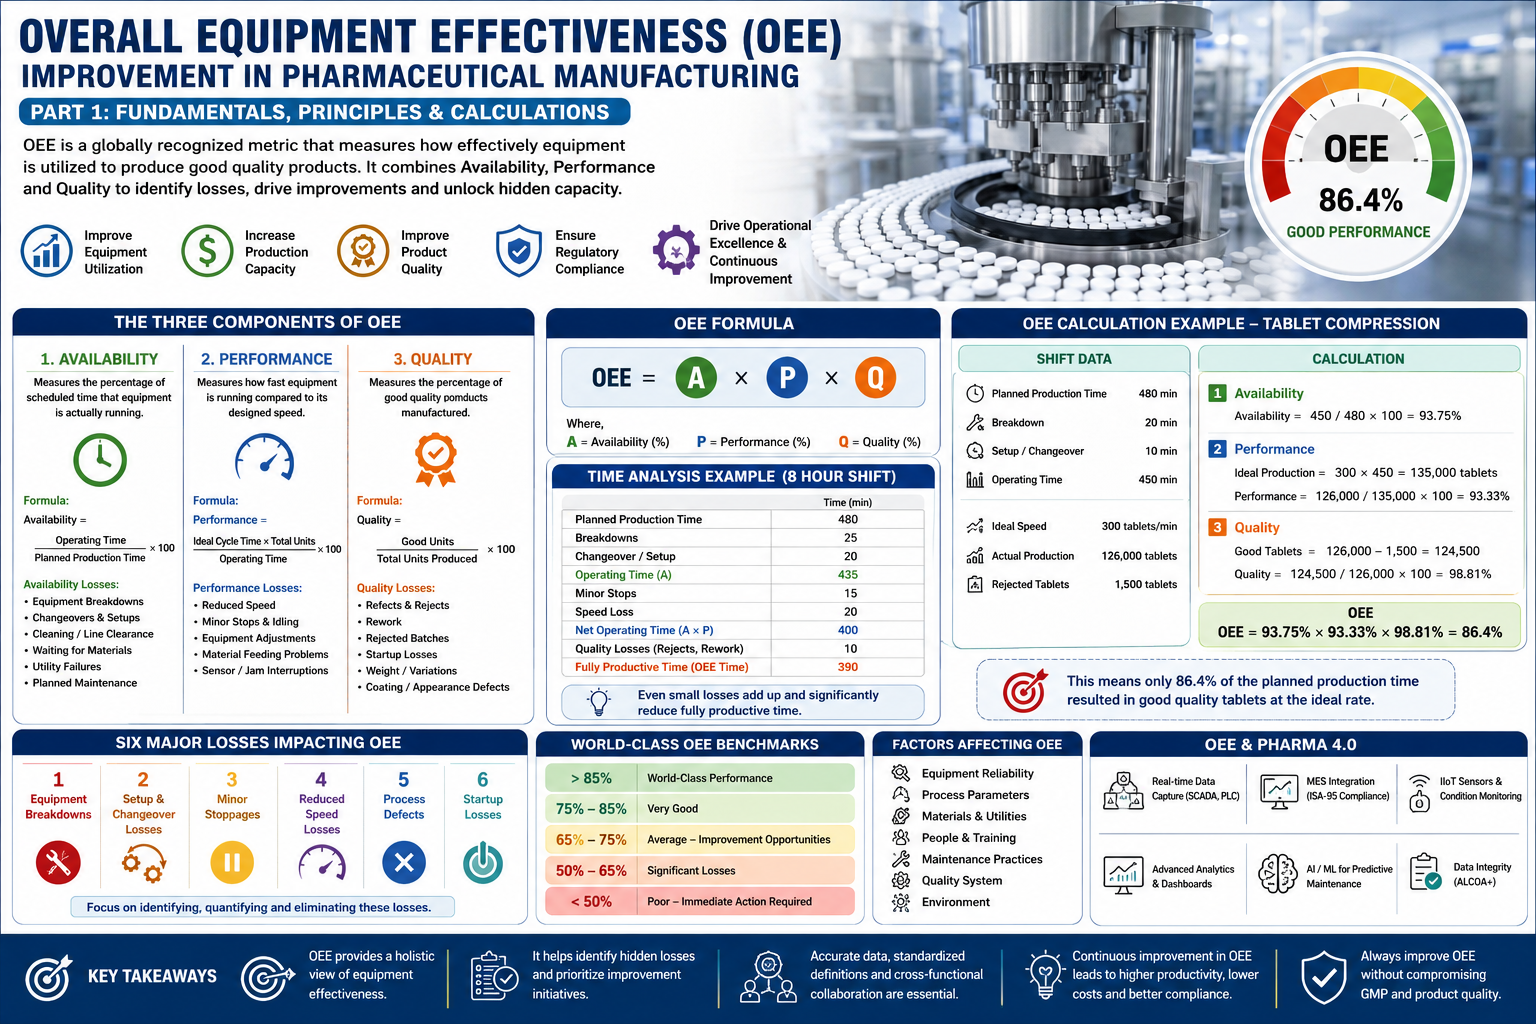
Part 1: Fundamentals, OEE Principles, Calculations, and Pharmaceutical Applications
Authoritative Guide for Pharmaceutical Manufacturing Professionals
Table of Contents
- Introduction to OEE
- Why OEE Matters in Pharmaceutical Manufacturing
- Understanding Manufacturing Losses
- Evolution of OEE
- OEE vs Production Efficiency
- Components of OEE
- Availability
- Performance
- Quality
- OEE Formula
- OEE Calculation Examples
- Pharmaceutical Manufacturing Examples
- World-Class OEE Benchmarks
- Factors Affecting OEE
- OEE Across Different Pharmaceutical Operations
- Regulatory Expectations
- OEE and Pharma 4.0
- Key Takeaways
1. Introduction
In today’s pharmaceutical industry, manufacturers are expected to produce high-quality medicines safely, consistently, and efficiently while complying with stringent global regulatory requirements. Increasing competition, rising production costs, supply chain pressures, and stricter quality expectations have made manufacturing excellence a strategic necessity rather than a competitive advantage.
One of the most effective methods for evaluating manufacturing performance is Overall Equipment Effectiveness (OEE). OEE is a globally recognized performance metric that measures how effectively manufacturing equipment is utilized compared with its full productive potential.
Unlike traditional metrics that only measure production output, OEE provides a comprehensive assessment by integrating:
- Equipment availability
- Production performance
- Product quality
This holistic view enables organizations to identify hidden losses, prioritize improvement initiatives, and increase manufacturing productivity without necessarily investing in new equipment.
2. Why OEE Is Important in Pharmaceutical Manufacturing
The pharmaceutical sector operates in a highly regulated environment where equipment downtime, speed losses, and quality deviations can directly affect patient safety, regulatory compliance, and business profitability.
Improving OEE helps organizations achieve:
- Higher equipment utilization
- Increased production capacity
- Reduced manufacturing costs
- Improved batch success rates
- Better product quality
- Lower rejection rates
- Faster batch release
- Enhanced regulatory compliance
- Improved data-driven decision-making
- Greater customer satisfaction
A 5% increase in OEE can often unlock significant additional production capacity, reducing the need for costly capital investments.
3. OEE in the Context of GMP
In pharmaceutical manufacturing, OEE must always align with Good Manufacturing Practices (GMP). Productivity improvements should never compromise product quality or regulatory compliance.
An effective OEE program supports GMP by promoting:
- Standardized operating procedures
- Controlled manufacturing processes
- Preventive maintenance
- Accurate documentation
- Equipment qualification and validation
- Data integrity
- Continuous monitoring
- Root cause analysis
- Corrective and preventive actions (CAPA)
4. Manufacturing Losses
Equipment rarely operates under ideal conditions. OEE helps quantify losses that reduce productive time.
The six classic manufacturing losses are:
- Equipment breakdowns
- Setup and changeover time
- Minor stoppages
- Reduced operating speed
- Process defects
- Startup losses
Understanding these losses is the first step toward improvement.
5. Evolution of OEE
OEE originated from Total Productive Maintenance (TPM) and has become a cornerstone of Lean Manufacturing and Operational Excellence programs.
Initially focused on equipment maintenance, OEE has evolved into a comprehensive performance management system that integrates:
- Lean Manufacturing
- Six Sigma
- Reliability Engineering
- Digital Manufacturing
- Manufacturing Execution Systems (MES)
- Industrial Internet of Things (IIoT)
- Artificial Intelligence (AI)
- Predictive Maintenance
- Pharma 4.0 initiatives
6. The Three Components of OEE
OEE is calculated using three key metrics:
- Availability
- Performance
- Quality
Each component represents a different aspect of equipment effectiveness.
Availability
Measures the percentage of scheduled production time during which equipment is actually running.
Formula:
Availability = Operating Time ÷ Planned Production Time × 100
Availability losses include:
- Equipment failures
- Machine breakdowns
- Utility failures
- Long changeovers
- Cleaning delays
- Waiting for maintenance
- Waiting for line clearance
- Material shortages
Performance
Performance measures whether equipment is operating at its designed speed.
Formula:
Performance = (Ideal Cycle Time × Total Units Produced) ÷ Operating Time × 100
Performance losses include:
- Reduced machine speed
- Operator interventions
- Frequent adjustments
- Minor stoppages
- Material feeding issues
- Sensor interruptions
- Equipment wear
Quality
Quality measures the percentage of products manufactured correctly the first time.
Formula:
Quality = Good Units ÷ Total Units Produced × 100
Quality losses include:
- Tablet defects
- Weight variation
- Broken tablets
- Coating defects
- Rejected batches
- Rework
- Startup rejects
7. OEE Formula
The complete OEE formula is:
OEE = Availability × Performance × Quality
For example:
Availability = 92%
Performance = 95%
Quality = 99%
OEE = 0.92 × 0.95 × 0.99
OEE = 86.5%
This means that only 86.5% of the planned production time results in good-quality products produced at the ideal rate.
8. Understanding OEE Through Time Analysis
Consider an 8-hour production shift (480 minutes).
| Description | Time (minutes) |
|---|---|
| Planned Production Time | 480 |
| Breakdowns | 25 |
| Changeover | 20 |
| Operating Time | 435 |
| Minor Stops | 15 |
| Speed Loss | 20 |
| Net Operating Time | 400 |
| Quality Losses | 10 |
| Fully Productive Time | 390 |
This breakdown illustrates how seemingly small losses accumulate, significantly reducing productive output.
9. Pharmaceutical Example: Tablet Compression
A tablet compression machine operates for an 8-hour shift.
Shift Data:
- Planned Production Time = 480 min
- Breakdown = 20 min
- Setup = 10 min
- Operating Time = 450 min
- Ideal Speed = 300 tablets/min
- Actual Production = 126,000 tablets
- Rejected Tablets = 1,500
Step 1 – Availability
Availability = 450 ÷ 480 × 100
= 93.75%
Step 2 – Performance
Ideal Production = 300 × 450
= 135,000 tablets
Performance = 126,000 ÷ 135,000 × 100
= 93.33%
Step 3 – Quality
Good Tablets = 126,000 − 1,500
= 124,500
Quality = 124,500 ÷ 126,000 × 100
= 98.81%
Step 4 – OEE
OEE = 0.9375 × 0.9333 × 0.9881
= 86.4%
10. Pharmaceutical Example: Blister Packing Line
Shift Duration: 600 minutes
- Planned Production = 600 min
- Downtime = 45 min
- Operating Time = 555 min
- Ideal Speed = 250 blisters/min
- Actual Output = 130,000 blisters
- Rejected = 2,000 blisters
Availability = 555 ÷ 600 = 92.5%
Ideal Output = 250 × 555 = 138,750
Performance = 130,000 ÷ 138,750 = 93.7%
Quality = 128,000 ÷ 130,000 = 98.5%
OEE = 92.5 × 93.7 × 98.5
= 85.3%
11. World-Class OEE Benchmarks
While target values vary by product, process, and equipment, the following benchmarks are widely used:
| OEE (%) | Interpretation |
|---|---|
| Above 85 | World-class performance |
| 75–85 | Very good |
| 65–75 | Average; improvement opportunities exist |
| 50–65 | Significant losses present |
| Below 50 | Poor performance; immediate action required |
For pharmaceutical manufacturing, sustaining OEE above 85% should never come at the expense of product quality or compliance.
12. Major Factors Affecting OEE
Several interconnected factors influence OEE in pharmaceutical operations:
Equipment-Related
- Aging machinery
- Inadequate preventive maintenance
- Component wear
- Calibration drift
Process-Related
- Long changeovers
- Cleaning delays
- Validation activities
- Frequent recipe changes
Material-Related
- Variable raw material quality
- Packaging material defects
- Feeding issues
People-Related
- Insufficient operator training
- Human error
- Inconsistent adherence to SOPs
Quality-Related
- High rejection rates
- Rework
- Investigations
- Deviations
Environmental
- HVAC fluctuations
- Utility interruptions
- Compressed air issues
- Temperature and humidity excursions
13. OEE Across Pharmaceutical Operations
OEE principles apply across various manufacturing processes:
| Process | Typical OEE Focus |
|---|---|
| Dispensing | Material readiness, weighing accuracy |
| Granulation | Downtime, binder preparation, cleaning |
| Drying | Cycle optimization, moisture control |
| Milling | Equipment reliability, throughput |
| Blending | Mixing time optimization |
| Compression | Speed, rejects, punch wear |
| Coating | Spray efficiency, coating defects |
| Capsule Filling | Fill accuracy, machine speed |
| Blister Packing | Changeover, sealing quality |
| Bottle Packaging | Labeling accuracy, line synchronization |
Each process has unique loss mechanisms that should be analyzed individually.
14. Regulatory Considerations
While OEE itself is not a regulatory requirement, regulators expect manufacturers to manage equipment and processes in a manner that ensures consistent product quality.
An effective OEE program supports compliance by demonstrating:
- Controlled equipment performance
- Preventive maintenance effectiveness
- Process capability
- Trend analysis
- Investigation of recurring losses
- CAPA effectiveness
- Risk-based decision-making
- Data integrity
When implemented correctly, OEE data can strengthen inspection readiness and support continuous process verification.
15. OEE and Digital Manufacturing
Modern pharmaceutical facilities increasingly leverage digital technologies to automate OEE data collection and analysis.
Common technologies include:
- Manufacturing Execution Systems (MES)
- Supervisory Control and Data Acquisition (SCADA)
- Programmable Logic Controllers (PLCs)
- Industrial Internet of Things (IIoT) sensors
- Real-time dashboards
- Advanced analytics
- Predictive maintenance algorithms
- Electronic Batch Records (EBR)
- Artificial Intelligence (AI) for anomaly detection
These tools reduce manual data entry, improve accuracy, and enable proactive decision-making.
16. Common Misconceptions About OEE
- Higher speed always improves OEE.
Increasing machine speed beyond validated limits may lead to defects and compliance risks. - OEE is only a maintenance metric.
OEE is a cross-functional performance indicator involving production, engineering, quality, maintenance, planning, and supply chain. - A high OEE guarantees profitability.
OEE is an operational metric. Business performance also depends on product mix, demand, inventory, and cost management. - Manual OEE tracking is sufficient.
Manual systems are prone to errors and delays. Digital data acquisition provides more accurate and timely insights.
17. Practical Tips for Starting an OEE Program
- Define standardized downtime categories.
- Ensure all equipment clocks and data sources are synchronized.
- Train operators on accurate event logging.
- Establish baseline OEE for each critical asset.
- Prioritize losses based on impact rather than assumptions.
- Review OEE daily during production meetings.
- Integrate OEE discussions with deviation management and CAPA.
- Use Pareto analysis to focus on the most significant losses.
- Celebrate incremental improvements to sustain engagement.
18. Key Takeaways
- OEE is a powerful metric for measuring manufacturing effectiveness by combining Availability, Performance, and Quality.
- In pharmaceutical manufacturing, OEE improvements must always align with GMP, validation requirements, and patient safety.
- Accurate data collection, standardized definitions, and cross-functional collaboration are essential for meaningful OEE analysis.
- Even modest improvements in OEE can yield substantial gains in capacity, cost efficiency, and operational reliability without additional capital investment.
- Digital technologies such as MES, SCADA, IIoT, and advanced analytics are transforming OEE from a retrospective metric into a real-time operational excellence tool.
Coming in Part 2
The next installment will focus on Availability Improvement, covering:
- The Six Big Losses in depth
- Equipment breakdown analysis
- Planned vs. unplanned downtime
- Changeover optimization using SMED
- Total Productive Maintenance (TPM) pillars
- Autonomous and preventive maintenance
- Reliability-centered maintenance (RCM)
- Failure Mode and Effects Analysis (FMEA)
- Root Cause Analysis (5 Whys, Fishbone, Fault Tree Analysis)
- MTBF and MTTR calculations
- Practical pharmaceutical case studies
- Availability improvement templates, KPIs, and implementation roadmap.
About the Author
Ramesh Palav is a seasoned professional in GxP Quality, Computer System Validation (CSV), Data Integrity, and Pharmaceutical IT Compliance. He has extensive experience in implementing and managing GxP computerized systems, risk-based validation, audit trails, data integrity, and regulatory compliance. Through his articles and professional insights, he aims to share practical knowledge and help pharmaceutical and life-sciences professionals strengthen quality, compliance, and data integrity.