
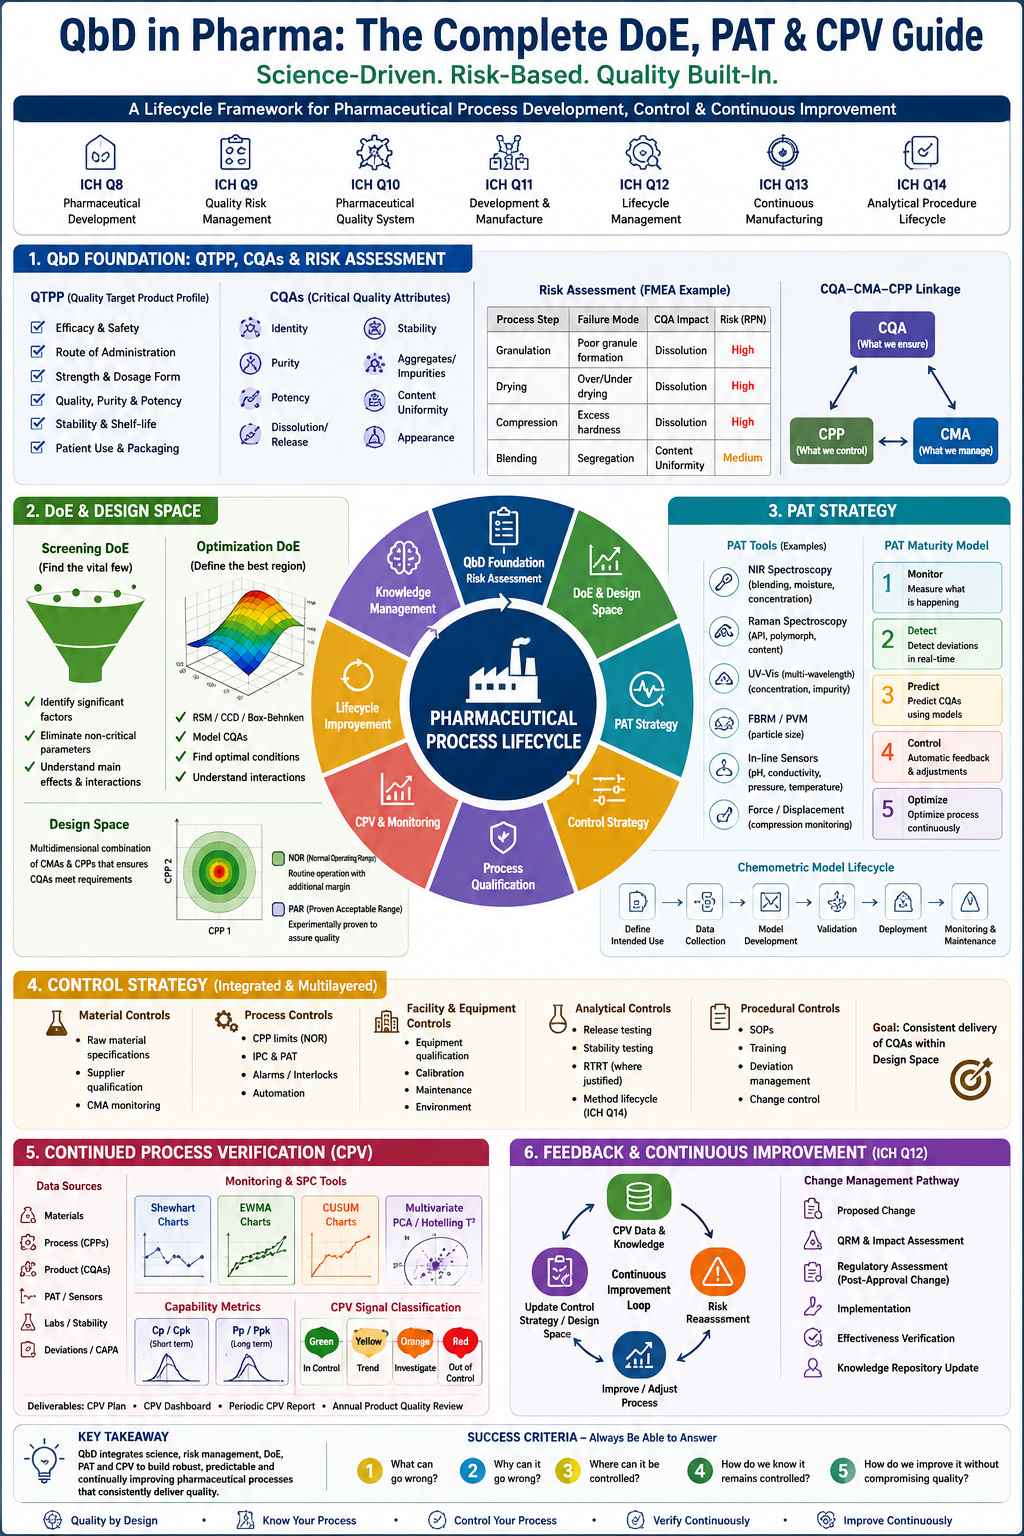
0. Executive Framework
The objective is to establish a science- and risk-based process understanding system that connects:
QTPP → CQAs → CMAs/CPPs → Risk Assessment → DoE → Design Space → Control Strategy → PAT → Process Qualification → CPV → Lifecycle Management
The fundamental principle is:
Quality should be designed into the product and process rather than tested into the finished product.
ICH Q8 establishes the pharmaceutical-development/QbD foundation, Q9 provides the quality-risk-management framework, Q10 establishes the pharmaceutical quality system, Q12 addresses lifecycle management and post-approval changes, Q13 addresses continuous manufacturing, and Q14 addresses analytical procedure development and lifecycle management.
FDA’s PAT framework similarly emphasizes scientific understanding of the process, risk-based control, and innovative process monitoring throughout the product lifecycle.
1. QbD Foundation — QTPP, CQAs and Risk Assessment
1.1 Define the Quality Target Product Profile
The QTPP is the prospective description of the product characteristics required to achieve the intended clinical performance.
QTPP Template
| QTPP Element | Target / Requirement | Potential CQA |
|---|---|---|
| Dosage form | [Tablet / Capsule / mAb DS/DP] | Physical/biological attributes |
| Route | [Oral / IV / SC] | Safety, efficacy |
| Strength | [X mg / mL] | Assay |
| Identity | Product-specific | Identity |
| Purity | Defined target | Related substances/aggregates |
| Potency | Product-specific | Potency |
| Stability | Shelf-life target | Degradation products |
| Dissolution | For oral dosage forms | Dissolution profile |
| Sterility | Where applicable | Sterility |
| Endotoxin | Where applicable | Endotoxin |
| Microbial quality | Product-specific | Bioburden |
| Appearance | Defined | Visual quality |
| Container closure | Product-specific | CCIT/stability |
| Patient-use characteristics | Product-specific | Dose delivery |
Deliverable
QTPP Document + Product Knowledge Summary
1.2 Identify Critical Quality Attributes
A CQA is a physical, chemical, biological or microbiological property that must remain within an appropriate limit, range or distribution to assure product quality.
Example — Solid Oral Dosage Form
Potential CQAs include:
- Assay
- Content uniformity
- Dissolution
- Related substances
- Degradation products
- Tablet weight
- Hardness
- Friability
- Disintegration
- Moisture
- Appearance
- Microbial quality
Example — Monoclonal Antibody
Potential CQAs include:
- Identity
- Purity
- Aggregates
- Fragments
- Charge variants
- Glycosylation
- Potency
- Protein concentration
- Host-cell proteins
- Residual DNA
- Endotoxin
- Bioburden
- Viral clearance
- Particulates
1.3 CQA Criticality Assessment
Use a structured scoring approach.
Suggested Criticality Score
Severity × Probability × Detectability = Risk Priority Number
Example:
| CQA | Severity | Probability | Detectability | RPN | Classification |
|---|---|---|---|---|---|
| Assay | 5 | 3 | 2 | 30 | High |
| Dissolution | 5 | 4 | 3 | 60 | Critical |
| Hardness | 3 | 3 | 2 | 18 | Medium |
| Appearance | 2 | 2 | 1 | 4 | Low |
The scoring system should be defined in the organization’s QRM procedure rather than treated as a universal regulatory scoring scale.
1.4 Process Mapping
Create a complete process flow:
Raw Materials → Dispensing → Processing Step 1 → Processing Step 2 → Intermediate → Final Processing → Packaging → Finished Product
For each operation identify:
- Process input
- CMA
- Process parameter
- CPP
- Intermediate CQA
- Final CQA
- Existing control
- Proposed PAT
- Sampling location
- Sampling frequency
- Failure mode
Example — OSD
Dispensing → Granulation → Drying → Milling → Lubrication → Compression → Coating → Packing
Example — mAb Downstream
Harvest → Clarification → Protein A → Viral Inactivation → Polishing → Virus Filtration → UF/DF → Final Bulk
1.5 Initial Risk Assessment
Use a combination of:
- Ishikawa/Fishbone
- FMEA
- HACCP
- Fault Tree Analysis
- Cause-and-effect matrix
- Historical manufacturing data
- Prior knowledge
- Scientific literature
- Development studies
FMEA Template
| Process Step | CMA/CPP | Potential Failure Mode | CQA Impact | Severity | Probability | Detectability | Risk | Control |
|---|---|---|---|---|---|---|---|---|
| Granulation | Binder concentration | Poor granule formation | Dissolution | 5 | 4 | 3 | High | IPC/PAT |
| Drying | Product temperature | Over/under drying | Dissolution | 5 | 3 | 3 | High | LOD/NIR |
| Compression | Compression force | Excess hardness | Dissolution | 5 | 4 | 2 | High | Force monitoring |
| Coating | Spray rate | Non-uniform coating | Dissolution | 4 | 3 | 3 | Medium | Weight gain/PAT |
1.6 Build the CQA–CPP–CMA Linkage
A key QbD deliverable is a CQA-CMA-CPP matrix.
| CQA | CMA | CPP | Relationship | Evidence |
|---|---|---|---|---|
| Dissolution | API particle size | Compression force | Direct | DoE |
| Assay | API potency | Blend time | Indirect | Development data |
| Content uniformity | API density | Blender speed | Direct | PAT/DoE |
| Purity | Raw material impurity | Process temperature | Direct | Development studies |
The goal is to transform a qualitative risk assessment into experimentally demonstrated process understanding.
2. DoE Strategy and Design Space
2.1 DoE Philosophy
DoE should answer three progressively deeper questions:
Stage 1 — Screening
Which factors matter?
Stage 2 — Characterization
How do important factors affect CQAs?
Stage 3 — Optimization
Where should the process operate to consistently achieve the desired quality?
Avoid changing one factor at a time as the primary development methodology when interactions are scientifically important.
2.2 Screening DoE
Potential approaches:
- Fractional factorial
- Full factorial
- Plackett-Burman
- Definitive screening design
- Custom optimal design
Example
Suppose eight potential CPPs are identified:
- Temperature
- pH
- Mixing speed
- Mixing time
- Feed rate
- Pressure
- Concentration
- Hold time
A screening DoE can determine which factors have meaningful effects on:
- Assay
- Purity
- Dissolution
- Particle size
- Yield
- Aggregation
- Impurity clearance
Screening Deliverables
- Factor selection
- Experimental matrix
- Randomization strategy
- Blocking strategy
- Response definitions
- Statistical model
- ANOVA
- Main-effect plots
- Interaction assessment
- Pareto chart
- Significant-factor list
2.3 Optimization DoE
After screening, select significant factors.
Typical approaches:
Response Surface Methodology
Use when:
- curvature is expected;
- interactions are important;
- optimization is required.
Central Composite Design
Useful for:
- quadratic response models;
- center points;
- estimating curvature;
- broad factor ranges.
Box-Behnken Design
Useful when:
- three or more factors are being optimized;
- extreme combinations are undesirable;
- quadratic modeling is required.
2.4 Example Optimization Model
For a CQA such as dissolution:
Y = β₀ + β₁X₁ + β₂X₂ + β₃X₃ + β₁₂X₁X₂ + β₁₃X₁X₃ + β₂₃X₂X₃ + β₁₁X₁² + β₂₂X₂² + β₃₃X₃²
Where:
- Y = response
- X₁ = compression force
- X₂ = lubricant concentration
- X₃ = granule moisture
Evaluate:
- statistical significance;
- model adequacy;
- residuals;
- lack of fit;
- prediction capability;
- interaction effects;
- practical significance.
2.5 Design Space
The Design Space should represent the multidimensional combination of material attributes and process parameters demonstrated to provide assurance of meeting predefined quality requirements.
Conceptually:
Design Space = Combination of CMAs + CPPs that delivers acceptable CQAs
Example:
| Parameter | Development Range | PAR | NOR |
|---|---|---|---|
| Temperature | 20–40°C | 25–35°C | 28–32°C |
| pH | 5.0–7.0 | 5.5–6.5 | 5.8–6.2 |
| Mixing speed | 50–150 rpm | 70–130 rpm | 90–110 rpm |
| Feed rate | 1–5 L/min | 2–4 L/min | 2.5–3.5 L/min |
Important distinction
PAR — Proven Acceptable Range
Range experimentally demonstrated to provide acceptable quality.
NOR — Normal Operating Range
The routine operating range selected inside the proven acceptable region, generally providing additional operational margin.
Design Space
Can be multidimensional and does not have to be represented as independent limits for every parameter.
2.6 Design Space Verification
Before implementation:
- verify scale dependence;
- evaluate equipment differences;
- assess raw-material variability;
- challenge edge-of-range conditions;
- evaluate worst-case combinations;
- confirm model predictions;
- perform engineering/registration batches where appropriate.
Deliverables
- Design Space Report
- Statistical Model Report
- Edge-of-Space Verification Protocol
- Design Space Verification Report
- Updated Control Strategy
- Regulatory filing content, where applicable
3. PAT Strategy
FDA’s PAT framework promotes process understanding and risk-based implementation of analytical technologies for process monitoring and control.
PAT should not be selected merely because an instrument is technologically advanced.
The fundamental question is:
What process or quality decision will this measurement enable?
3.1 PAT Technology Selection Matrix
| Process | Potential PAT | Target Variable | Purpose |
|---|---|---|---|
| Blending | NIR | Blend uniformity | Endpoint/control |
| Granulation | NIR/Raman | Moisture/composition | Endpoint |
| Drying | NIR | Moisture | Endpoint |
| Compression | Force/displacement | Tablet characteristics | Process control |
| Coating | NIR/weight gain | Coating state | Endpoint |
| Bioreactor | Raman | Glucose/lactate | Feed control |
| Chromatography | UV | Protein concentration | Fraction control |
| UF/DF | UV/Conductivity | Concentration/buffer state | Process control |
| Particle formation | FBRM/PVM | Particle size | Process control |
3.2 PAT Classification
Inline
Measurement occurs directly within the process stream without removing the sample.
Examples:
- Inline Raman
- Inline NIR
- Inline UV
- Inline conductivity
- Inline pressure
- Inline temperature
Online
Sample is automatically transported to an analyzer.
At-line
Sample is removed and analyzed close to the process.
3.3 PAT Control Hierarchy
A mature PAT program should evolve through:
Monitor → Detect → Predict → Control → Optimize
Example:
Level 1 — Monitoring
NIR measures moisture.
Level 2 — Detection
System identifies abnormal drying trajectory.
Level 3 — Prediction
Chemometric model predicts final moisture.
Level 4 — Control
Drying endpoint automatically terminates.
Level 5 — Optimization
System dynamically adjusts process conditions based on model predictions.
3.4 Chemometric Model Lifecycle
For NIR/Raman or other multivariate PAT:
Step 1 — Define Intended Use
Specify:
- attribute being predicted;
- operating range;
- measurement location;
- sample matrix;
- accuracy requirement;
- decision criteria.
Step 2 — Data Generation
Collect representative samples covering:
- normal variation;
- raw-material variability;
- process extremes;
- scale;
- equipment;
- manufacturing sites where applicable.
Step 3 — Spectral Preprocessing
Potential techniques:
- SNV
- MSC
- derivatives
- smoothing
- baseline correction
Step 4 — Model Development
Possible approaches:
- PLS
- PCR
- PCA
- SIMCA
- multivariate classification
- machine-learning models where scientifically justified
Step 5 — Model Validation
Evaluate:
- RMSEC
- RMSEP
- bias
- precision
- robustness
- specificity
- leverage
- outliers
- prediction uncertainty
FDA has specific guidance addressing development and submission of NIR analytical procedures using chemometric models.
Step 6 — Model Deployment
Control:
- software;
- instrument configuration;
- model version;
- cybersecurity;
- data integrity;
- audit trail;
- access control.
Step 7 — Model Monitoring
Monitor:
- spectral drift;
- instrument drift;
- prediction residuals;
- applicability domain;
- reference-method correlation;
- abnormal spectra.
Step 8 — Model Maintenance
Establish:
Model Change Control → Impact Assessment → Recalibration/Update → Verification → Approval → Deployment
3.5 PAT and Real-Time Release Testing
Where scientifically justified, PAT can support Real-Time Release Testing (RTRT).
The fundamental chain is:
PAT Measurement → Validated Model → CQA Prediction → Acceptance Criterion → Batch Disposition
This requires strong scientific evidence demonstrating that the PAT measurement/model provides reliable information about the relevant quality attribute.
ICH Q14 specifically includes considerations for multivariate analytical procedures and real-time release testing.
4. Control Strategy Development
The final QbD output should be a scientifically justified Control Strategy.
4.1 Control Strategy Components
Include:
Material Controls
- API attributes
- Excipient properties
- Raw-material variability
- Supplier controls
Process Controls
- CPP limits
- IPCs
- PAT
- alarms
- interlocks
- automated controls
Facility/Equipment Controls
- equipment capability;
- calibration;
- environmental controls;
- utilities;
- cleaning;
- maintenance.
Analytical Controls
- release testing;
- stability testing;
- PAT;
- reference methods;
- sampling strategy.
Procedural Controls
- SOPs;
- batch records;
- training;
- deviation management;
- change control.
5. Process Validation and Technology Transfer
FDA’s process-validation framework treats validation as a lifecycle activity encompassing process design, process qualification and continued process verification.
Stage 1 — Process Design
Demonstrate:
- scientific understanding;
- QTPP;
- CQAs;
- risk assessment;
- DoE;
- Design Space;
- control strategy.
Stage 2 — Process Qualification
Demonstrate:
- facility readiness;
- equipment qualification;
- utilities;
- manufacturing reproducibility;
- process performance;
- operator readiness;
- analytical readiness.
Stage 3 — Continued Process Verification
Demonstrate:
- ongoing state of control;
- process capability;
- trend stability;
- CQA consistency;
- variability reduction;
- timely detection of emerging risks.
6. Continued Process Verification — CPV
FDA describes CPV as ongoing collection and evaluation of process and product data to ensure the process remains in a state of control.
CPV should not be treated as simply generating annual trend charts.
It should function as a process-health surveillance system.
6.1 CPV Data Architecture
Collect data from:
Material
- supplier;
- lot;
- particle size;
- moisture;
- potency;
- density;
- critical excipient attributes.
Process
- CPPs;
- equipment;
- operator/shift;
- environmental conditions;
- batch duration;
- process interruptions.
Product
- CQAs;
- IPCs;
- release results;
- stability;
- deviations;
- complaints.
PAT
- spectra;
- predicted CQAs;
- endpoint data;
- sensor trends;
- model diagnostics.
6.2 SPC Strategy
Use different statistical tools for different signals.
Shewhart Charts
Best for detecting large, sudden shifts.
I-MR Charts
Useful for individual batch measurements.
X-bar/R or X-bar/S Charts
Useful where rational subgroups exist.
EWMA
Useful for detecting small persistent shifts.
CUSUM
Useful for detecting gradual process drift.
6.3 Process Capability
Use:
Cp / Cpk
when the process is statistically stable and the specification limits are meaningful.
Use:
Pp / Ppk
to describe longer-term observed performance.
Example:
Cpk = minimum[(USL − μ)/(3σ), (μ − LSL)/(3σ)]
Do not interpret a high Cpk as proof of process control if the process is unstable.
6.4 Suggested CPV Classification
| Signal | Example | Action |
|---|---|---|
| Green | Stable, capable process | Routine monitoring |
| Yellow | Trend/drift | Investigation/trending |
| Orange | Significant shift | Formal assessment |
| Red | Out-of-control/OOS | Investigation + CAPA |
Thresholds should be scientifically justified and defined in the approved CPV procedure.
6.5 Multivariate CPV
For highly interconnected processes, univariate charts may miss emerging problems.
Consider:
- PCA
- PLS
- Mahalanobis distance
- Hotelling’s T²
- SPE/Q residuals
- multivariate control charts
- multivariate batch fingerprinting
Example:
20 CPPs + 10 CQAs → Multivariate Process Health Index
This can provide earlier detection of complex process drift than monitoring each parameter independently.
7. Feedback and Feedforward Control
A mature QbD system should create a closed-loop knowledge architecture.
Feedforward
Material Attribute → Predictive Model → Process Adjustment
Example:
Higher API moisture detected → adjust granulation/drying parameters.
Feedback
Process Measurement → CQA Prediction → Process Correction
Example:
PAT predicts moisture above target → drying conditions automatically adjusted.
CPV Feedback
Commercial Data → Trend Detection → Investigation → CAPA/Change → Updated Control Strategy
This is the foundation of continual improvement.
8. ICH Q12 Lifecycle Management
ICH Q12 provides a framework intended to make post-approval CMC change management more predictable and efficient while supporting continual improvement.
The lifecycle architecture should therefore distinguish:
Established/Registered Elements
Parameters or attributes requiring regulatory consideration according to the applicable filing and jurisdiction.
Operational Controls
Routine manufacturing controls managed within the pharmaceutical quality system.
Knowledge Management
Accumulated scientific and manufacturing knowledge supporting future decisions.
Change Management
Every proposed change should undergo:
Change → QRM → Impact on CQA/CPP/Design Space → Regulatory Assessment → Implementation → Effectiveness Verification
9. Knowledge Management System
Create a living Process Knowledge Repository.
Maintain:
- QTPP;
- CQA list;
- CMA list;
- CPP list;
- risk assessments;
- DoE datasets;
- statistical models;
- Design Space;
- PAT models;
- CPV data;
- deviations;
- CAPA;
- complaints;
- stability;
- process changes;
- validation reports;
- technology-transfer knowledge.
This converts isolated development studies into a lifecycle process knowledge base.
10. Recommended Lifecycle Implementation Roadmap
Phase 1 — Product Understanding
Activities
- QTPP definition
- CQA identification
- prior knowledge review
- product characterization
Deliverables
- QTPP
- CQA register
- Product Knowledge Report
Phase 2 — Process Understanding
Activities
- process mapping
- CMA identification
- CPP identification
- initial FMEA
- Ishikawa analysis
Deliverables
- Process Flow Diagram
- CQA-CMA-CPP Matrix
- Initial Risk Assessment
Phase 3 — Experimental Development
Activities
- screening DoE
- optimization DoE
- interaction studies
- scale-up studies
Deliverables
- DoE Protocol
- DoE Report
- Statistical Model
- Significant-Factor Matrix
Phase 4 — Design Space
Activities
- response-surface modeling
- multidimensional assessment
- edge-of-space studies
- scale verification
Deliverables
- Design Space
- PAR
- NOR
- Design Space Verification Report
Phase 5 — PAT Development
Activities
- technology selection
- sensor placement
- sampling strategy
- chemometric model development
- model validation
Deliverables
- PAT Strategy
- PAT URS
- PAT Risk Assessment
- Chemometric Model Report
- PAT Validation/Verification Package
Phase 6 — Control Strategy
Integrate:
CMA Controls + CPP Controls + IPC + PAT + Specifications + Automation + Sampling
Deliverable:
Integrated Pharmaceutical Control Strategy
Phase 7 — Process Qualification
Demonstrate:
- reproducibility;
- robustness;
- equipment capability;
- process capability;
- control-system effectiveness.
Deliverables
- PPQ Protocol
- PPQ Batch Data
- PPQ Report
- Process Validation Summary
Phase 8 — Commercial CPV
Establish:
- data collection;
- SPC;
- capability analysis;
- CQA trending;
- CPP trending;
- PAT monitoring;
- multivariate monitoring;
- annual/product-quality review integration.
Deliverable:
Continued Process Verification Plan and Periodic CPV Report
Phase 9 — Lifecycle Improvement
Use:
CPV → Knowledge → Risk Reassessment → Improvement → Change Control → Regulatory Assessment → Implementation → CPV
This closes the lifecycle loop.
11. Master CQA–CPP–PAT–CPV Matrix
| CQA | Risk Driver | CPP/CMA | PAT | IPC | CPV Metric | Control |
|---|---|---|---|---|---|---|
| Assay | API variability | API potency/blending | NIR | Blend uniformity | Cpk/Ppk | Material + blending control |
| Dissolution | Granule properties | Moisture/compression | NIR/force | Hardness/LOD | Trend/Cpk | Design Space |
| Content Uniformity | Segregation | Blend time/speed | NIR | Blend uniformity | Within/between batch variation | PAT endpoint |
| Aggregates | Process stress | Temperature/pH | SEC/offline + process sensors | IPC | Trend | CPP control |
| Protein concentration | UF/DF variability | TMP/feed rate | UV | Concentration | Cpk/Ppk | Automated control |
| Particle size | Process conditions | Mixing/shear | FBRM/PVM | Particle-size analysis | Distribution trend | Process control |
12. Governance Model
A successful QbD program should be cross-functional.
Core Team
- Process Development
- Manufacturing
- QA
- QC
- Analytical Development
- Engineering
- Automation
- Data Science
- Regulatory CMC
- Validation
- MSAT/Technology Transfer
- Supply Chain
- Microbiology, where applicable
Governance Gates
Gate 1: QTPP/CQA approval
Gate 2: Risk assessment approval
Gate 3: DoE strategy approval
Gate 4: Design Space approval
Gate 5: Control Strategy approval
Gate 6: PPQ readiness
Gate 7: CPV readiness
Gate 8: Lifecycle review
13. Minimum Documentation Package
A mature QbD implementation should ultimately contain:
- QTPP
- CQA Register
- CMA Register
- CPP Register
- Process Flow Diagram
- Initial Risk Assessment
- CQA-CMA-CPP Matrix
- DoE Protocol
- DoE Report
- Statistical Model Report
- Design Space Report
- PAR/NOR Justification
- PAT Strategy
- PAT URS
- PAT Risk Assessment
- Chemometric Model Development Report
- Chemometric Model Validation Report
- Control Strategy
- Process Validation Master Plan/Strategy
- PPQ Protocol
- PPQ Report
- CPV Plan
- CPV Dashboard
- CPV Periodic Report
- Knowledge Management Record
- Lifecycle Risk Assessment
- Change Management Strategy
- Regulatory Impact Assessment
14. Final Integrated Lifecycle Model
The complete framework can be visualized as:
QTPP
↓
CQA Identification
↓
CMA + CPP Identification
↓
QRM / FMEA / Ishikawa
↓
Screening DoE
↓
Optimization DoE
↓
Process Characterization
↓
Design Space
↓
PAT Development
↓
Integrated Control Strategy
↓
Technology Transfer / Scale-Up
↓
Process Qualification
↓
Commercial Manufacturing
↓
CPV + SPC + Multivariate Monitoring
↓
Process Capability Assessment
↓
Knowledge Management
↓
Risk Reassessment
↓
Continuous Improvement / Change Management
↓
ICH Q12 Lifecycle Management
↓
Updated Control Strategy / Design Space / Process Knowledge
↓
Next CPV Cycle
15. Key Regulatory Philosophy
The strongest regulatory position is not simply:
“We tested the process and it passed.”
It is:
“We understand the sources of variability, understand their relationship with CQAs, have demonstrated scientifically justified operating ranges, have implemented an integrated control strategy, continuously monitor process performance, and use lifecycle knowledge to maintain and improve the state of control.”
That philosophy aligns the QbD development approach with FDA’s process-validation lifecycle concept and the ICH Q8/Q9/Q10/Q12 framework. FDA’s Q8/Q9/Q10 Q&A also explicitly describes design-space development, verification, lifecycle management, CPV and continual improvement of the control strategy as connected elements of an enhanced development approach.
Practical Success Criteria
A mature implementation should be able to answer five questions at any time:
- What can go wrong? → QRM/FMEA
- Why can it go wrong? → Process understanding/DoE
- Where can it be controlled? → Design Space/Control Strategy
- How do we know it remains controlled? → PAT/IPC/CPV/SPC
- How do we improve it without compromising quality? → Knowledge Management + ICH Q12 Change Management
The ultimate objective is a living, data-driven pharmaceutical process that moves from empirical manufacturing → scientifically understood manufacturing → statistically controlled manufacturing → predictive manufacturing → continuously improving manufacturing.
About the Author
Ramesh Palav is a pharmaceutical manufacturing professional with 21+ years of experience in Oral Solid Dosage manufacturing, production operations, GMP compliance, qualification, validation, QMS and operational excellence. Through Pharma Manufacturing Hub, he shares practical industry knowledge with pharmaceutical professionals, students and manufacturing leaders.