
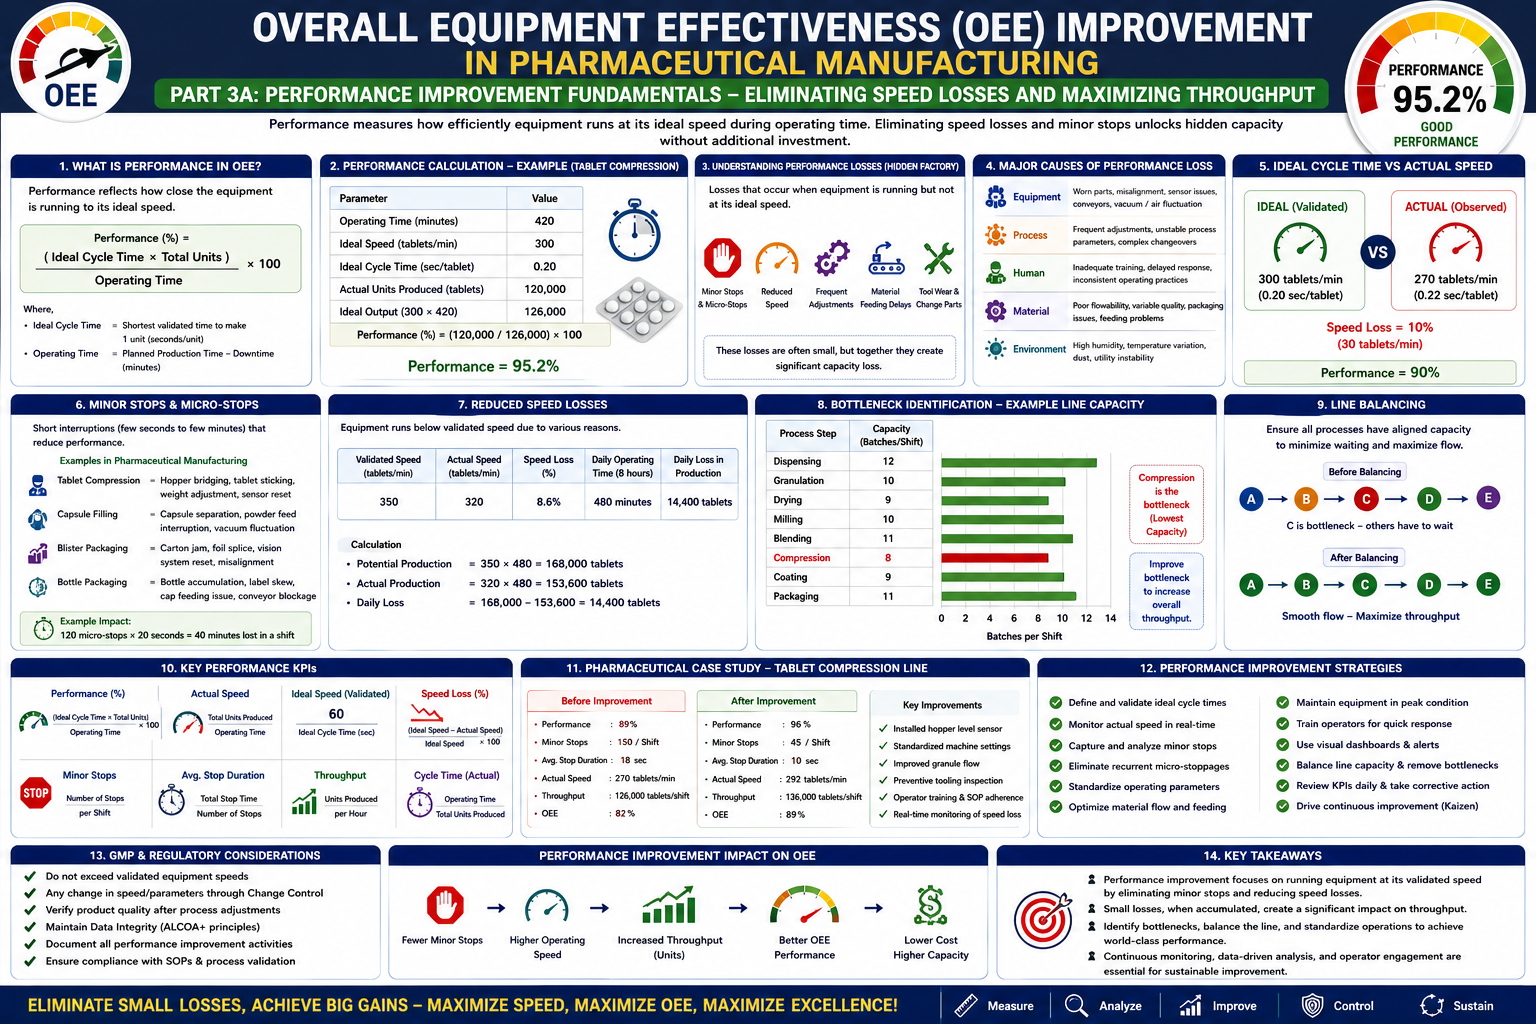
Part 3A: Performance Improvement Fundamentals – Eliminating Speed Losses and Maximizing Throughput
A Comprehensive Guide for Pharmaceutical Manufacturing Excellence
Table of Contents
- Introduction to Performance in OEE
- Understanding the Performance Component
- Why Performance Matters in Pharmaceutical Manufacturing
- Performance Losses and Hidden Factory
- Major Causes of Performance Losses
- Ideal Cycle Time
- Actual Operating Speed
- Performance Calculation Methodology
- Minor Stops and Micro-Stoppages
- Reduced Speed Losses
- Bottleneck Identification
- Line Balancing
- Performance KPIs
- Pharmaceutical Case Study
- GMP & Regulatory Considerations
- Performance Improvement Strategies
- Key Takeaways
1. Introduction to Performance in OEE
After improving Availability by minimizing equipment downtime, the next challenge is ensuring that equipment operates at its validated and designed speed. A machine may be available throughout the shift, but if it runs below its ideal cycle time or experiences frequent micro-stoppages, overall productivity suffers.
The Performance component of Overall Equipment Effectiveness (OEE) measures how efficiently equipment converts operating time into productive output.
Performance losses are often hidden because equipment appears to be running. However, reduced speed, frequent short stops, operator interventions, and process instability gradually erode production capacity. These losses, commonly referred to as the Hidden Factory, can significantly impact throughput without being immediately visible.
2. Understanding the Performance Component
Performance measures how closely equipment operates to its ideal production rate.
Formula
Performance (%) = (Ideal Cycle Time × Total Units Produced ÷ Operating Time) × 100
Alternatively:
Performance (%) = (Actual Output ÷ Ideal Output) × 100
Where:
- Ideal Cycle Time: The shortest validated time required to manufacture one unit under normal operating conditions.
- Operating Time: Planned production time minus downtime.
- Ideal Output: Maximum output achievable at the validated speed during operating time.
Example
- Operating Time = 420 minutes
- Ideal Speed = 300 tablets/minute
- Actual Output = 120,000 tablets
Ideal Output = 420 × 300 = 126,000 tablets
Performance = (120,000 ÷ 126,000) × 100 = 95.2%
This indicates that the equipment operated at 95.2% of its validated production capability.
3. Why Performance Matters in Pharmaceutical Manufacturing
Unlike many industries, pharmaceutical manufacturing operates within validated process limits. Equipment cannot simply be accelerated to increase output, as speed changes may affect:
- Tablet hardness
- Weight variation
- Coating uniformity
- Capsule fill weight
- Blend homogeneity
- Packaging integrity
- Product quality
- Regulatory compliance
Performance improvement therefore focuses on eliminating unnecessary losses while maintaining validated operating conditions.
Benefits include:
- Increased throughput
- Reduced production cycle time
- Improved schedule adherence
- Lower manufacturing cost
- Higher OEE
- Better asset utilization
4. Performance Losses and the Hidden Factory
The Hidden Factory refers to production capacity lost through inefficiencies that are not immediately apparent.
Common hidden losses include:
- Running below validated speed
- Frequent operator adjustments
- Short machine interruptions
- Material feeding delays
- Sensor interruptions
- Minor jams
- Temporary alarms
- Waiting for inspections
- Cleaning interruptions
- Tool wear
Although each event may last only a few seconds or minutes, their cumulative impact can be substantial.
5. Major Causes of Performance Losses
Equipment-Related
- Worn tooling
- Bearing wear
- Conveyor misalignment
- Drive slippage
- Sensor contamination
- Vacuum instability
- Pneumatic pressure fluctuations
Process-Related
- Frequent adjustments
- Poor granule flow
- Inconsistent material feeding
- Product change complexity
- Batch size variation
Human Factors
- Inadequate operator training
- Delayed response to alarms
- Inconsistent machine settings
- Manual intervention
Material Factors
- Poor raw material flow
- Packaging material variability
- Carton dimensional variation
- Foil feeding issues
Environmental Factors
- Humidity variation
- Temperature fluctuation
- Dust accumulation
- Utility instability
6. Ideal Cycle Time
The Ideal Cycle Time represents the fastest validated production rate under normal operating conditions.
Tablet Compression Example
Validated speed = 320 tablets/minute
Ideal Cycle Time = 60 seconds ÷ 320
= 0.1875 seconds per tablet
Ideal cycle time must always be based on validated process parameters and approved manufacturing instructions.
7. Actual Operating Speed
Actual operating speed is the real production rate achieved during manufacturing.
Example
Validated Speed = 300 tablets/minute
Actual Production = 270 tablets/minute
Speed Loss = 30 tablets/minute
Performance = (270 ÷ 300) × 100 = 90%
This 10% speed loss directly reduces production capacity.
8. Performance Calculation Methodology
Example: Tablet Compression Machine
- Operating Time = 450 minutes
- Ideal Speed = 300 tablets/minute
- Actual Production = 126,000 tablets
Ideal Output = 450 × 300 = 135,000 tablets
Performance = (126,000 ÷ 135,000) × 100 = 93.3%
Example: Blister Packaging Line
- Operating Time = 480 minutes
- Ideal Speed = 250 blisters/minute
- Actual Production = 114,000 blisters
Ideal Output = 480 × 250 = 120,000 blisters
Performance = (114,000 ÷ 120,000) × 100 = 95.0%
9. Minor Stops and Micro-Stoppages
Minor stops are brief interruptions—typically lasting a few seconds to a few minutes—that often escape formal downtime recording but collectively reduce performance.
Common Examples
Tablet Compression
- Hopper bridging
- Tablet sticking
- Weight adjustment
- Sensor reset
- Punch cleaning
Capsule Filling
- Capsule separation issues
- Powder feeding interruptions
- Vacuum fluctuations
Blister Packaging
- Carton jams
- Foil splice adjustments
- Vision system resets
- Product misalignment
Bottle Packaging
- Bottle accumulation
- Label skew
- Cap feeding interruptions
- Conveyor blockages
Impact
A line experiencing 120 micro-stoppages of 20 seconds each loses approximately 40 minutes of productive time in a shift.
10. Reduced Speed Losses
Equipment may operate below validated speed due to:
- Conservative machine settings
- Tool wear
- Frequent adjustments
- Material inconsistencies
- Operator caution
- Mechanical degradation
Example
Validated Speed = 350 tablets/minute
Actual Speed = 320 tablets/minute
Daily Operating Time = 8 hours
Potential Production = 168,000 tablets
Actual Production = 153,600 tablets
Daily Loss = 14,400 tablets
Over one year, this represents millions of tablets in lost production capacity.
11. Bottleneck Identification
A bottleneck is the slowest process in the production line, limiting overall throughput.
Example: Tablet Manufacturing Line
| Process | Capacity (Batches/Shift) |
|---|---|
| Dispensing | 12 |
| Granulation | 10 |
| Drying | 9 |
| Milling | 10 |
| Blending | 11 |
| Compression | 8 |
| Coating | 9 |
| Packaging | 11 |
Compression is the bottleneck, as it has the lowest capacity.
Bottleneck Improvement Strategies
- Optimize equipment settings
- Improve preventive maintenance
- Reduce minor stops
- Enhance operator training
- Improve material flow
- Balance upstream and downstream processes
12. Line Balancing
Line balancing ensures that each process step has sufficient capacity to support the overall production rate.
Objectives
- Minimize waiting time
- Eliminate idle equipment
- Synchronize production flow
- Improve throughput
- Reduce work-in-process (WIP)
Practical Approaches
- Redistribute tasks among operators
- Standardize work methods
- Optimize material handling
- Adjust staffing levels
- Improve equipment reliability
13. Performance KPIs
Monitoring the right Key Performance Indicators (KPIs) enables continuous improvement.
| KPI | Formula |
|---|---|
| Performance (%) | Actual Output ÷ Ideal Output × 100 |
| Actual Speed | Units Produced ÷ Operating Time |
| Ideal Speed | Validated Design Speed |
| Speed Loss (%) | (Ideal Speed − Actual Speed) ÷ Ideal Speed × 100 |
| Minor Stops | Number of Stops per Shift |
| Average Stop Duration | Total Stop Time ÷ Number of Stops |
| Throughput | Units Produced per Hour |
| Cycle Time | Operating Time ÷ Units Produced |
Regular KPI reviews help identify trends and prioritize improvement efforts.
14. Pharmaceutical Case Study
Scenario
A tablet compression line consistently achieved an OEE Performance score of 89%.
Investigation Findings
- Frequent hopper blockages
- Punch wear
- Manual weight adjustments
- Delayed replenishment of granules
- Operators using inconsistent machine settings
Improvement Actions
- Installed low-level hopper sensors.
- Standardized machine setup parameters.
- Increased punch inspection frequency.
- Improved granule flow characteristics.
- Conducted operator training.
Results After Three Months
| Metric | Before | After |
|---|---|---|
| Performance | 89% | 96% |
| Minor Stops | 150/Shift | 45/Shift |
| Throughput | 126,000 tablets | 136,000 tablets |
| OEE | 82% | 89% |
15. GMP & Regulatory Considerations
Performance improvement initiatives must maintain validated process conditions and comply with GMP.
Key considerations include:
- Do not exceed validated equipment speeds.
- Document any approved parameter changes through change control.
- Verify product quality after process adjustments.
- Maintain complete records of machine settings and performance data.
- Ensure electronic records comply with ALCOA+ data integrity principles.
- Confirm that performance improvements do not compromise critical quality attributes (CQAs).
16. Performance Improvement Strategies
To maximize the Performance component of OEE:
- Establish validated ideal cycle times for all critical equipment.
- Monitor actual speed continuously using MES or SCADA.
- Capture and analyze minor stops.
- Eliminate recurring micro-stoppages through Root Cause Analysis.
- Standardize machine setup and operating parameters.
- Optimize material flow to prevent starvation and blockages.
- Improve tooling management and inspection practices.
- Train operators on rapid troubleshooting and standardized work.
- Use real-time dashboards to monitor speed losses and throughput.
- Review performance KPIs during daily production meetings.
17. Key Takeaways
- Performance measures how efficiently equipment operates relative to its validated production capability.
- Minor stops, reduced speed, and process instability are often hidden losses that significantly impact OEE.
- Identifying bottlenecks, balancing production lines, and standardizing operating practices are essential for improving throughput.
- Continuous monitoring of Performance KPIs, combined with Lean Manufacturing and Root Cause Analysis, enables sustainable productivity gains.
- All performance improvements in pharmaceutical manufacturing must preserve validated process conditions, product quality, and regulatory compliance.
Coming in Part 3B: Lean Manufacturing & Process Optimization
The next installment will focus on advanced methods for eliminating waste and optimizing production flow, including:
- Lean Manufacturing Principles in Pharma
- The Eight Wastes (TIMWOODS)
- Value Stream Mapping (VSM)
- Kaizen and Continuous Improvement
- 5S Workplace Organization
- Visual Management
- Standard Work
- Line Balancing and Capacity Optimization
- Statistical Process Control (SPC)
- Practical Pharmaceutical Case Studies
- Lean Implementation Roadmap, Templates, and Best Practices for achieving world-class manufacturing performance.
About the Author
Ramesh Palav is a seasoned professional in GxP Quality, Computer System Validation (CSV), Data Integrity, and Pharmaceutical IT Compliance. He has extensive experience in implementing and managing GxP computerized systems, risk-based validation, audit trails, data integrity, and regulatory compliance. Through his articles and professional insights, he aims to share practical knowledge and help pharmaceutical and life-sciences professionals strengthen quality, compliance, and data integrity.