
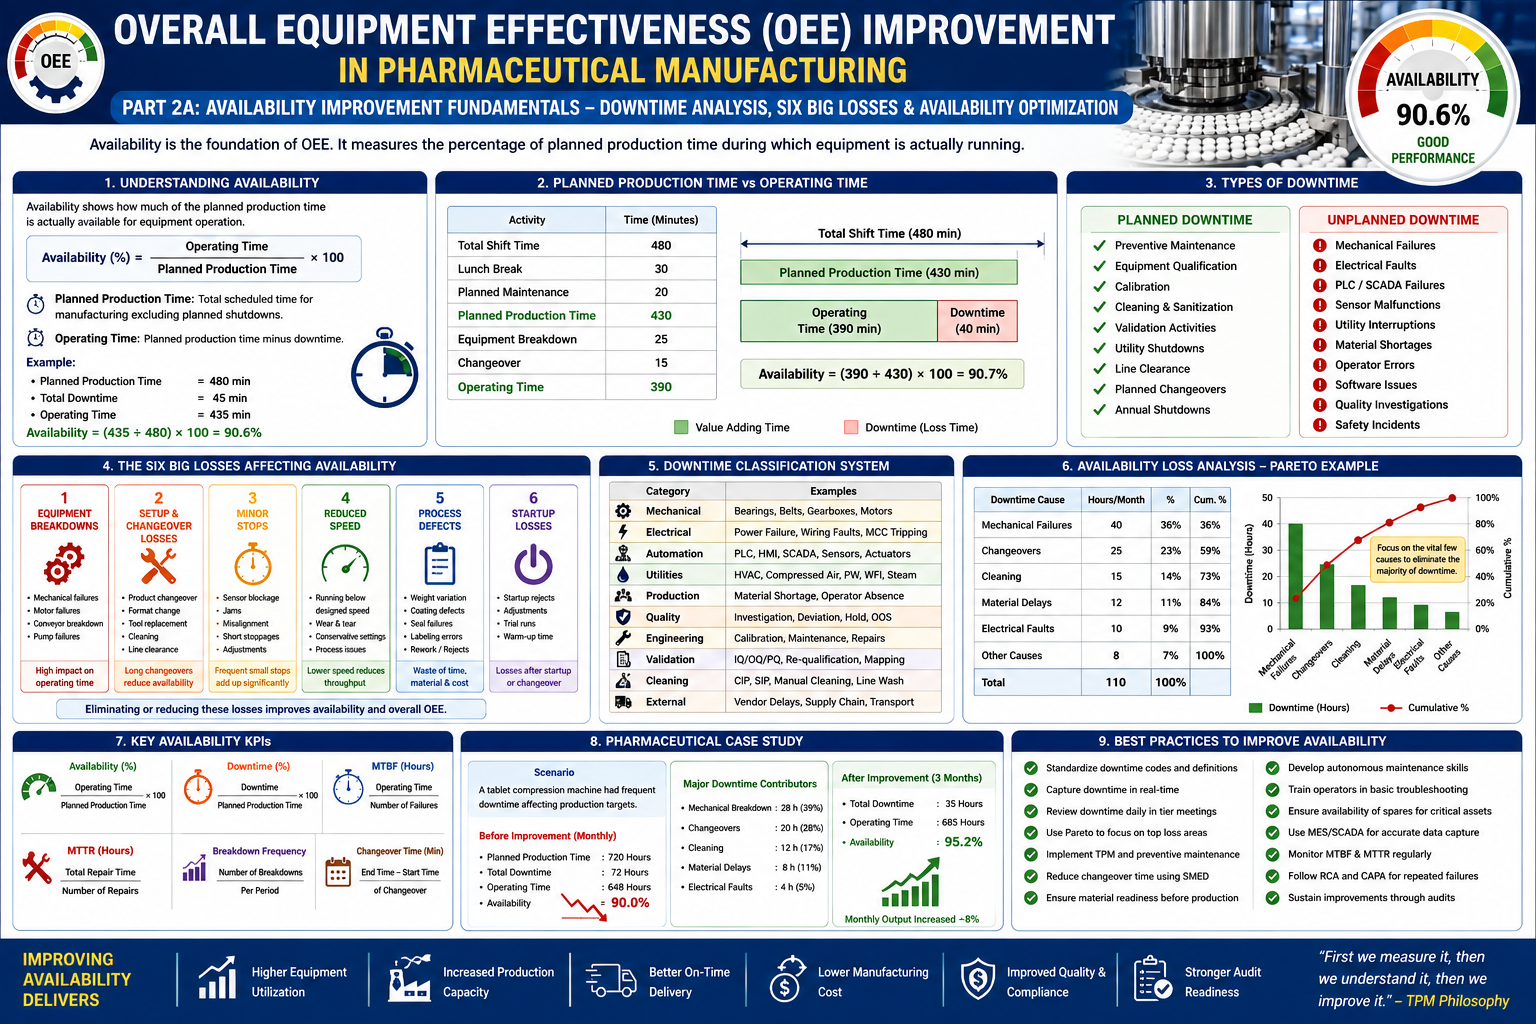
Part 2A: Availability Improvement Fundamentals – Downtime Analysis, Six Big Losses, and Availability Optimization
Table of Contents
- Introduction to Availability
- Understanding Availability in OEE
- Planned Production Time vs Operating Time
- Types of Downtime in Pharmaceutical Manufacturing
- The Six Big Losses Affecting Availability
- Downtime Classification System
- Availability Calculation Methodology
- Measuring Availability in Different Pharmaceutical Processes
- Key Factors Influencing Availability
- Downtime Data Collection and Analysis
- Availability KPIs
- Pharmaceutical Case Study
- Regulatory and GMP Considerations
- Best Practices for Improving Availability
- Key Takeaways
1. Introduction
Availability is the first pillar of Overall Equipment Effectiveness (OEE) and serves as the foundation for manufacturing productivity. In pharmaceutical manufacturing, even the most advanced equipment cannot deliver optimal performance if it is frequently unavailable due to breakdowns, lengthy changeovers, utility failures, or operational delays.
Unlike many industries where downtime primarily impacts productivity, in pharmaceutical manufacturing it also influences:
- Batch cycle time
- Product availability
- Regulatory compliance
- Equipment qualification status
- Cleaning validation schedules
- Manufacturing costs
- Customer service levels
Improving equipment availability increases manufacturing capacity without the need for additional capital investment. By systematically identifying and eliminating downtime losses, organizations can achieve significant gains in throughput, operational efficiency, and compliance.
2. Understanding Availability in OEE
Availability measures the proportion of planned production time during which equipment is actually operating.
Formula:
Availability (%) = (Operating Time ÷ Planned Production Time) × 100
Where:
- Planned Production Time = Total scheduled manufacturing time excluding planned shutdowns.
- Operating Time = Planned production time minus downtime.
Example:
- Planned Production Time = 480 minutes
- Total Downtime = 45 minutes
Operating Time = 480 − 45 = 435 minutes
Availability = (435 ÷ 480) × 100 = 90.6%
This indicates that the equipment was available for productive operation for 90.6% of the scheduled production time.
3. Planned Production Time vs. Operating Time
A clear distinction between planned production time and operating time is essential for accurate OEE measurement.
| Parameter | Description |
|---|---|
| Calendar Time | Total time available (24/7 basis) |
| Planned Production Time | Scheduled manufacturing time excluding holidays and planned shutdowns |
| Downtime | Time lost due to equipment or process interruptions |
| Operating Time | Actual time the equipment is running |
Example:
| Activity | Time (Minutes) |
|---|---|
| Total Shift | 480 |
| Lunch Break | 30 |
| Planned Maintenance | 20 |
| Planned Production Time | 430 |
| Equipment Breakdown | 25 |
| Changeover | 15 |
| Operating Time | 390 |
Availability = (390 ÷ 430) × 100 = 90.7%
4. Types of Downtime in Pharmaceutical Manufacturing
Downtime is generally categorized as planned or unplanned.
Planned Downtime
Planned downtime includes activities intentionally scheduled to support compliant and reliable operations.
Examples include:
- Preventive maintenance
- Equipment qualification
- Calibration
- Cleaning and sanitization
- Validation activities
- Utility shutdowns
- Line clearance
- Planned changeovers
- Annual maintenance shutdowns
Although planned, these activities should still be optimized to minimize production impact.
Unplanned Downtime
Unplanned downtime occurs unexpectedly and often results in the greatest productivity losses.
Examples include:
- Mechanical failures
- Electrical faults
- PLC or SCADA failures
- Sensor malfunctions
- Utility interruptions
- HVAC failures
- Compressed air loss
- Material shortages
- Operator errors
- Software issues
- Quality investigations
- Safety incidents
5. The Six Big Losses Affecting Availability
The concept of the Six Big Losses, introduced through Total Productive Maintenance (TPM), helps classify and prioritize equipment losses.
1. Equipment Breakdowns
Examples:
- Compression machine gearbox failure
- Coating pan motor failure
- Capsule filler vacuum pump malfunction
- Packaging conveyor failure
Impact:
- Reduced operating time
- Missed production schedules
- Increased maintenance costs
2. Setup and Changeover Losses
Typical activities include:
- Product changeovers
- Batch transitions
- Tool replacement
- Format changes
- Cleaning
- Line clearance
- Documentation updates
Long changeovers directly reduce equipment availability.
3. Minor Stops
Minor stops are short interruptions that often go unrecorded but accumulate significantly.
Examples:
- Sensor blockage
- Tablet jams
- Bottle misalignment
- Blister film adjustment
- Label roll replacement
4. Reduced Speed
Machines operating below validated speeds due to wear, adjustments, or conservative settings reduce throughput without necessarily causing downtime.
5. Process Defects
Quality issues leading to rejected product or rework consume productive capacity.
Examples:
- Weight variation
- Coating defects
- Seal failures
- Incorrect labeling
6. Startup Losses
Losses occurring after:
- Equipment startup
- Maintenance
- Product changeover
- Cleaning
- Validation
These include adjustments, trial runs, and initial rejects.
6. Downtime Classification System
A standardized downtime classification enables consistent analysis across production areas.
| Category | Examples |
|---|---|
| Mechanical | Bearings, belts, gearboxes, motors |
| Electrical | Power failure, wiring faults |
| Automation | PLC, HMI, SCADA, sensors |
| Utilities | HVAC, compressed air, purified water |
| Production | Material shortage, operator absence |
| Quality | Investigation, deviation, hold |
| Engineering | Calibration, maintenance |
| Validation | IQ/OQ/PQ activities |
| Cleaning | CIP, SIP, manual cleaning |
| External | Vendor delays, supply chain issues |
7. Availability Loss Analysis
A Pareto analysis often reveals that a small number of causes contribute to the majority of downtime.
Illustrative Example:
| Cause | Downtime (Hours/Month) | Percentage |
|---|---|---|
| Mechanical Failures | 40 | 36% |
| Changeovers | 25 | 23% |
| Cleaning | 15 | 14% |
| Material Delays | 12 | 11% |
| Electrical Faults | 10 | 9% |
| Other | 8 | 7% |
Targeting the top contributors can yield substantial improvements.
8. Measuring Availability Across Pharmaceutical Operations
Availability metrics should be tailored to specific processes.
Granulation
Common downtime causes:
- Binder preparation delays
- Impeller failures
- Discharge issues
Compression
Typical losses:
- Punch replacement
- Weight adjustments
- Hopper bridging
- Mechanical wear
Coating
Frequent causes:
- Spray nozzle clogging
- Airflow imbalance
- Pump failures
- Cleaning delays
Blister Packaging
Typical downtime:
- Foil changeovers
- Sealing temperature adjustments
- Cartoner jams
- Vision inspection faults
9. Factors Influencing Availability
Equipment Reliability
- Aging assets
- Poor maintenance
- Component wear
- Inadequate lubrication
Process Design
- Complex changeovers
- Long cleaning cycles
- Manual interventions
- Inefficient workflows
Human Factors
- Inadequate training
- SOP non-compliance
- Delayed troubleshooting
- Communication gaps
Material Management
- Late material availability
- Packaging defects
- Incorrect component staging
Utilities
- HVAC instability
- Compressed air pressure drops
- Purified water interruptions
- Electrical fluctuations
10. Downtime Data Collection
Reliable data is the foundation of effective availability improvement.
Manual Collection
Operators record:
- Start time
- Stop time
- Downtime reason
- Corrective action
- Responsible department
Digital Collection
Automated systems include:
- Manufacturing Execution Systems (MES)
- SCADA
- PLC event logs
- IIoT sensors
- Electronic Batch Records (EBR)
Benefits include improved accuracy, real-time visibility, and faster root cause analysis.
11. Availability KPIs
Key indicators include:
| KPI | Formula |
|---|---|
| Availability (%) | Operating Time ÷ Planned Production Time × 100 |
| Downtime (%) | Downtime ÷ Planned Production Time × 100 |
| Mean Time Between Failures (MTBF) | Operating Time ÷ Number of Failures |
| Mean Time to Repair (MTTR) | Total Repair Time ÷ Number of Repairs |
| Breakdown Frequency | Number of Breakdowns per Period |
| Planned Maintenance Ratio | Planned Maintenance Time ÷ Total Maintenance Time |
| Changeover Time | End Time − Start Time of Changeover |
Tracking these KPIs over time helps identify trends and measure improvement.
12. Pharmaceutical Case Study
Scenario
A tablet compression machine experiences frequent stoppages.
Monthly Data:
- Planned Production Time = 720 hours
- Mechanical Breakdown = 28 hours
- Changeovers = 20 hours
- Cleaning = 12 hours
- Material Delays = 8 hours
- Electrical Faults = 4 hours
Total Downtime = 72 hours
Operating Time = 720 − 72 = 648 hours
Availability = (648 ÷ 720) × 100 = 90.0%
Improvement Actions
- Implement preventive maintenance schedule.
- Standardize changeover procedures.
- Stage materials before production.
- Introduce autonomous maintenance.
- Analyze recurring failures using Pareto and 5 Whys.
Results After Three Months
| Metric | Before | After |
|---|---|---|
| Availability | 90.0% | 95.2% |
| Mechanical Downtime | 28 h | 12 h |
| Changeover Time | 20 h | 11 h |
| Material Delays | 8 h | 2 h |
| Monthly Output | Increased by ~8% |
This demonstrates how targeted improvements in availability can significantly enhance productivity.
13. Regulatory and GMP Considerations
Availability improvement initiatives must support—not compromise—regulatory compliance.
Key considerations include:
- Maintain validated equipment status after maintenance.
- Document all downtime events accurately.
- Follow approved SOPs for maintenance and changeovers.
- Ensure calibration is current before production.
- Record maintenance activities in equipment logbooks or electronic systems.
- Assess changes through formal change control.
- Investigate repeated failures through CAPA.
- Preserve data integrity in all electronic records (ALCOA+ principles).
14. Best Practices for Improving Availability
- Establish standardized downtime codes.
- Perform daily review of downtime events.
- Conduct Pareto analysis to identify major loss categories.
- Integrate production, engineering, and quality teams in review meetings.
- Implement visual dashboards for real-time monitoring.
- Schedule preventive maintenance based on equipment criticality.
- Train operators in basic autonomous maintenance tasks.
- Reduce changeover duration through standardized work.
- Use digital systems (MES/SCADA) for automated data capture.
- Continuously verify improvements through KPI reviews and audits.
15. Key Takeaways
- Availability is the cornerstone of Overall Equipment Effectiveness and directly influences manufacturing capacity.
- Understanding and classifying downtime accurately is essential for meaningful analysis.
- Mechanical failures, changeovers, and cleaning activities are often the largest contributors to availability loss in pharmaceutical plants.
- Standardized data collection, cross-functional collaboration, and disciplined maintenance practices are critical for sustainable improvement.
- Enhancing availability not only boosts productivity but also strengthens GMP compliance, audit readiness, and overall operational excellence.
Coming in Part 2B: TPM & Maintenance Excellence
The next installment will explore advanced strategies to maximize equipment reliability, including:
- The Eight Pillars of Total Productive Maintenance (TPM)
- Autonomous Maintenance (Jishu Hozen)
- Planned and Preventive Maintenance
- Predictive Maintenance using vibration, thermography, and condition monitoring
- Reliability-Centered Maintenance (RCM)
- Mean Time Between Failures (MTBF) and Mean Time to Repair (MTTR) calculations
- Spare Parts Management and Criticality Analysis
- AI-driven Predictive Maintenance and Pharma 4.0 applications
- Pharmaceutical maintenance case studies
- TPM implementation roadmap, templates, and best practices for GMP-compliant facilities.
About the Author
Ramesh Palav is a pharmaceutical manufacturing professional with 21+ years of experience in Oral Solid Dosage manufacturing, production operations, GMP compliance, qualification, validation, QMS and operational excellence. Through Pharma Manufacturing Hub, he shares practical industry knowledge with pharmaceutical professionals, students and manufacturing leaders.