
By Ramesh Palav | Pharma Manufacturing Hub
Introduction
Overall Equipment Effectiveness, commonly known as OEE, is one of the most useful measures for understanding how effectively manufacturing equipment is being utilized. But on a pharmaceutical shop floor, improving OEE is not as simple as making a machine run faster.
A compression machine may have excellent output during a shift, yet the actual OEE can remain disappointing because of frequent minor stoppages, long changeovers, tooling problems, startup rejection, waiting for materials, or quality-related interruptions.
This is something that becomes very clear when OEE is viewed from the shop floor rather than only from a spreadsheet.
In pharmaceutical manufacturing, particularly Oral Solid Dosage (OSD) operations, OEE improvement has to balance three things at the same time:
Productivity + Quality + GMP Compliance
The objective is not to keep equipment running at any cost. The objective is to reduce avoidable losses while maintaining validated processes, product quality, patient safety and regulatory compliance.
A practical OEE improvement program therefore begins with a simple question:
Where is the manufacturing time actually being lost, and why?
Once that question is answered using reliable data and proper root-cause analysis, improvement opportunities become much easier to identify.
1. What Is OEE?
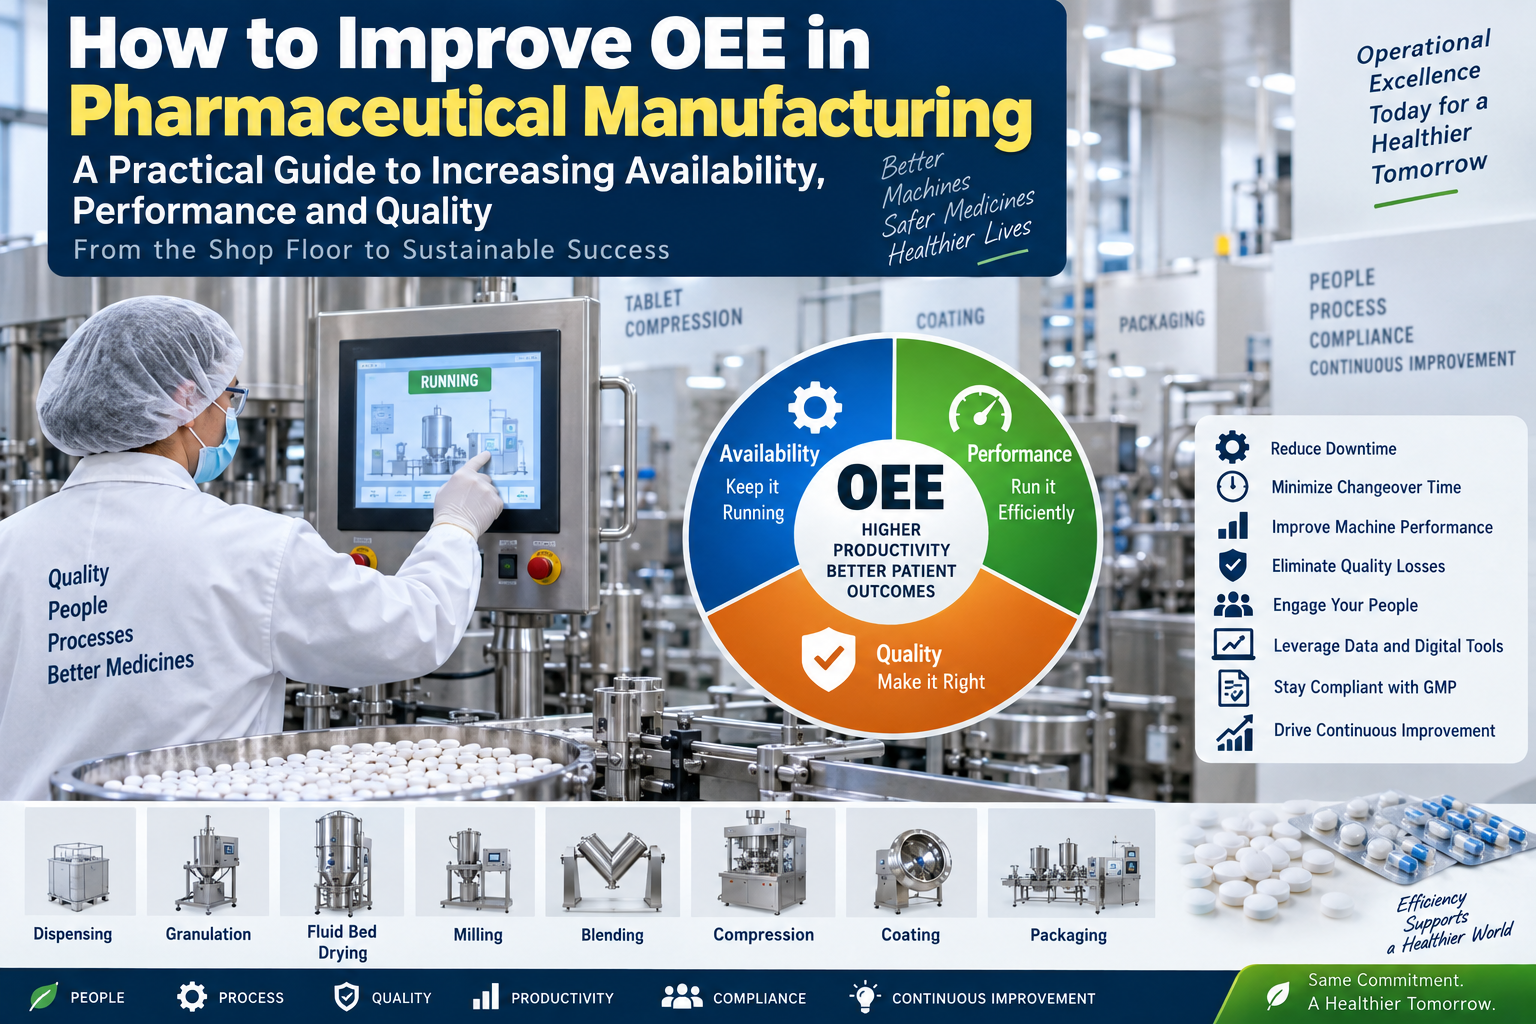
Overall Equipment Effectiveness (OEE) measures how effectively available production time is converted into good-quality products.
The conventional calculation is:
OEE = Availability × Performance × Quality
Each component represents a different type of manufacturing loss.
| OEE Component | What it measures | Typical pharmaceutical losses |
|---|---|---|
| Availability | How much planned time equipment was actually available to run | Breakdown, changeover, cleaning, setup, waiting |
| Performance | Whether equipment ran at its expected rate | Reduced speed, minor stops, inefficient feeding |
| Quality | How much output met quality requirements | Rejection, rework, startup defects |
The strength of OEE is that it prevents a plant from looking only at production quantity.
For example, producing more tablets does not necessarily mean the process has improved if the additional output comes with increased rejection, excessive machine wear, or GMP deviations.
2. Why OEE Matters in Pharmaceutical Manufacturing
Pharmaceutical manufacturing has several characteristics that make OEE improvement particularly challenging.
A production line may lose time because:
- Raw material is not available at the required time.
- Equipment is waiting for maintenance.
- QA is completing line clearance.
- Cleaning takes longer than planned.
- Tooling is not ready.
- A compression machine experiences repeated punch-related problems.
- Coating parameters require adjustment.
- A batch is held because of an investigation.
- Operators spend excessive time making routine adjustments.
- Packaging components are unavailable.
- Utilities are unstable.
Individually, these losses may appear small.
Collectively, they can consume a significant portion of planned manufacturing time.
This is why an OEE program should not begin with the question, “What OEE percentage should we achieve?”
It should begin with:
“What are our biggest losses?”
3. Understanding Availability, Performance and Quality
3.1 Availability
Availability answers a straightforward question:
Of the time we planned to manufacture, how much time was the equipment actually available for production?
A simplified calculation is:
Availability = Operating Time ÷ Planned Production Time × 100
Typical availability losses in OSD manufacturing include:
- Equipment breakdown
- Changeover
- Cleaning
- Setup
- Line clearance
- Waiting for raw materials
- Waiting for packaging materials
- Waiting for QA approval
- Utility interruption
- Planned and unplanned maintenance
- Documentation-related delays
Example: Tablet Compression
Suppose a compression machine is scheduled for production for 8 hours.
During the shift:
- 45 minutes are lost during changeover.
- 30 minutes are lost because of a breakdown.
- 15 minutes are lost waiting for tooling.
The machine did not necessarily have a serious technical problem for the entire shift. Nevertheless, those losses directly affect availability.
4. Performance: The Losses That Are Often Overlooked
Performance measures how efficiently equipment operates while it is running.
A machine can be technically available but still produce less than its expected output.
Common performance losses include:
- Reduced operating speed
- Frequent minor stoppages
- Poor material feeding
- Tooling issues
- Operator adjustments
- Process instability
- Product characteristics affecting machine speed
- Excessive machine vibration
- Feeding-system interruptions
A common shop-floor situation
A compression machine is designed and qualified to operate at a certain production rate. During routine production, however, the operator repeatedly reduces speed because tablets begin showing weight variation or sticking.
The machine may show good availability because it did not stop.
But performance has suffered.
The answer is therefore not necessarily to instruct the operator to increase speed.
The better question is:
Why cannot the machine consistently operate at the established validated or approved operating condition?
That investigation could lead to:
- Granule characteristics
- Lubrication
- Compression-force variation
- Punch condition
- Feeder performance
- Machine settings
- Environmental conditions
- Operator technique
The underlying process issue must be addressed before simply increasing speed.
5. Quality: The Third Part of OEE
Quality measures the proportion of production that meets the defined requirements.
Typical quality losses in pharmaceutical manufacturing include:
- Tablet weight variation
- Hardness failure
- Friability failure
- Capping
- Lamination
- Sticking
- Picking
- Coating defects
- Appearance defects
- Packaging defects
- Startup rejection
- Rework
- In-process rejection
A machine producing 100,000 tablets per hour does not necessarily represent excellent performance if a significant quantity is subsequently rejected.
That is why OEE combines productivity and quality.
6. Practical OEE Calculation
Consider a hypothetical tablet compression operation.
Assume:
- Planned production time = 8 hours
- Planned production time = 480 minutes
- Breakdown/changeover/other downtime = 60 minutes
- Operating time = 420 minutes
- Ideal production rate = 1,000 tablets/minute
- Total tablets produced = 390,000
- Good tablets = 382,200
Step 1: Availability
Availability:
420 ÷ 480 × 100 = 87.5%
Step 2: Performance
Expected production during operating time:
420 × 1,000 = 420,000 tablets
Actual production:
390,000 tablets
Performance:
390,000 ÷ 420,000 × 100 = 92.86%
Step 3: Quality
Good tablets:
382,200
Total tablets:
390,000
Quality:
382,200 ÷ 390,000 × 100 = 98.0%
Step 4: OEE
OEE:
87.5% × 92.86% × 98.0%
= 79.6% approximately
This example demonstrates something important.
The OEE is not determined by one problem.
There are losses in:
- Availability
- Performance
- Quality
Improvement therefore requires looking at all three.
7. The Major OEE Losses in Pharmaceutical Manufacturing
A useful OEE program should categorize losses consistently.
Equipment breakdown
Breakdowns directly reduce equipment availability.
Repeated breakdowns are particularly important because they often indicate an underlying reliability problem.
Changeover
Product changeover can include:
- Equipment cleaning
- Tooling change
- Machine setup
- Line clearance
- Documentation
- Product changeover verification
Minor stoppages
These are often underestimated.
A machine may stop for 30 seconds, one minute or two minutes repeatedly.
Each event appears insignificant.
Hundreds of such events over a shift can become a substantial performance loss.
Reduced speed
Operating below the established expected rate may indicate:
- Equipment condition
- Product characteristics
- Material variability
- Process limitations
- Operator practices
- Tooling condition
Quality losses
Startup rejection and process rejection directly reduce the quality component of OEE.
Waiting losses
Manufacturing equipment can remain idle while waiting for:
- Materials
- Components
- QA clearance
- Maintenance
- Documentation
- Utilities
- Decision-making
These losses should be visible in the OEE data rather than hidden under a generic category such as “other.”
8. Eight-Step OEE Improvement Framework
A practical improvement program can be built around eight steps.
Step 1 – Establish the Baseline
Before making improvements, determine the current position.
Measure:
- OEE
- Availability
- Performance
- Quality
- Downtime
- Changeover time
- Rejection
- Minor stoppages
The baseline should be based on reliable data.
Step 2 – Capture Accurate Downtime Data
This is one of the most important steps.
If every downtime event is entered simply as “Machine Problem,” meaningful analysis becomes difficult.
Instead, use meaningful categories such as:
- Punch problem
- Feeder problem
- Lubrication issue
- Electrical fault
- Mechanical fault
- Sensor fault
- Material shortage
- Cleaning
- Changeover
- QA waiting
- Utility interruption
Better categorization produces better analysis.
9. Step 3 – Use Pareto Analysis
A Pareto chart can help identify the small number of losses responsible for a large proportion of lost time.
For example, a hypothetical compression line may show:
| Loss | Lost Time |
|---|---|
| Tooling-related stoppages | 18 hr |
| Changeover | 14 hr |
| Feeder problems | 11 hr |
| Minor stoppages | 9 hr |
| Breakdown | 7 hr |
| Other | 5 hr |
Instead of launching ten improvement projects simultaneously, the team can investigate the largest contributors first.
This is much more effective than spreading resources across too many small initiatives.
10. Step 4 – Conduct Root Cause Analysis
Once the major loss is identified, ask:
Why is it happening repeatedly?
Useful tools include:
5 Why
Useful for straightforward recurring problems.
Fishbone Analysis
Useful for exploring potential causes across:
- Man
- Machine
- Material
- Method
- Measurement
- Environment
FMEA
Useful for assessing potential failure modes and prioritizing risks.
Fault Tree Analysis
Useful when investigating complex equipment or system failures.
Trend Analysis
Useful for determining whether the problem is associated with:
- Product
- Equipment
- Shift
- Operator
- Batch
- Campaign
- Time period
11. Two Practical Pharmaceutical Examples
Example 1: Repeated Compression Stoppages
A compression machine experiences frequent stoppages caused by tablet sticking.
Instead of repeatedly cleaning the punches and restarting the machine, the team investigates further.
Possible contributors include:
- Granule moisture
- Lubrication
- Compression parameters
- Punch condition
- Product formulation
- Machine temperature
- Environmental humidity
The improvement should address the actual cause rather than treating each stoppage as an isolated event.
Example 2: Coating Machine Performance Loss
A coating machine is available for most of the shift, but actual output is lower than expected.
Investigation shows that operators repeatedly reduce spray rate and pan speed because of concerns about coating defects.
Further investigation may identify:
- Inappropriate process parameters
- Spray-gun condition
- Nozzle blockage
- Atomization issues
- Tablet-bed condition
- Exhaust-air conditions
The OEE problem is therefore partly a process-control problem, not simply a machine-speed problem.
12. Reducing Changeover Time Using SMED Principles
Changeover is a major opportunity for OEE improvement.
SMED — Single-Minute Exchange of Die — provides useful principles for reducing changeover time.
In pharmaceutical manufacturing, however, SMED cannot be applied blindly.
GMP requirements remain the priority.
Useful activities include:
Prepare externally
Before the machine stops:
- Confirm materials
- Prepare tooling
- Verify documents
- Prepare cleaning equipment
- Check required spare parts
- Confirm personnel availability
Standardize setup
Develop clear and controlled procedures for:
- Tooling
- Machine settings
- Cleaning
- Assembly
- Verification
Parallel activities
Where GMP procedures permit, different team members can perform appropriate activities simultaneously rather than sequentially.
The goal should be to remove unnecessary waiting—not to remove required controls.
Cleaning validation, line clearance, QA verification and other required GMP controls must never be bypassed to improve OEE.
13. Maintenance and OEE
Equipment reliability is closely connected to OEE.
A good maintenance strategy normally includes a combination of:
- Preventive Maintenance
- Predictive Maintenance
- Corrective Maintenance
- Breakdown Maintenance
- Autonomous Maintenance
Preventive Maintenance
Scheduled maintenance can reduce unexpected failures.
Predictive Maintenance
Where appropriate, condition-based monitoring can identify developing problems before equipment failure.
Autonomous Maintenance
Operators can be trained to identify basic abnormal conditions such as:
- Leakage
- Abnormal noise
- Loose components
- Unusual vibration
- Lubrication issues
- Sensor contamination
Spare parts management
A technically simple breakdown can become a long production stoppage if the required spare part is unavailable.
Therefore, critical-spares identification should form part of the reliability strategy.
14. Operator Involvement is Essential
One mistake I have seen in manufacturing improvement programs is treating OEE as an Engineering KPI.
It is not.
Operators interact with equipment every shift.
They often know:
- Which machine makes abnormal noise
- Which product creates repeated problems
- Which punch set requires frequent adjustment
- Which feeder needs attention
- Which changeover step takes the longest
- Which alarm appears repeatedly
A good improvement culture encourages operators to report these observations.
Training should cover:
- SOP compliance
- Equipment operation
- Basic abnormality identification
- Startup checks
- Cleaning requirements
- Machine settings
- Shift handover
- Escalation procedures
An operator should not be expected to solve a technical problem outside their authorization. But their observations can provide valuable information to Production, Engineering and QA.
15. Improving Machine Performance
Performance improvement should begin with understanding why the machine is running below its expected rate.
Consider a tablet compression line.
Instead of saying:
“Increase machine speed.”
ask:
- Is the feeder stable?
- Is the tooling in good condition?
- Are punches and dies appropriate?
- Is the granule flow consistent?
- Is lubrication controlled?
- Are minor stoppages recorded?
- Are operators making frequent manual adjustments?
- Is the machine operating within approved process parameters?
This approach creates sustainable improvement.
16. Digitalization and OEE Monitoring
Technology can significantly improve OEE visibility.
Depending on the facility and system architecture, manufacturers may use:
- SCADA/HMI
- MES
- Historian systems
- Electronic Batch Records
- Digital dashboards
- Automated downtime capture
- Production data historians
- Analytics platforms
Real-time dashboards can make it easier to see:
What happened?
Where did it happen?
How long did it last?
How often is it happening?
What is the trend?
However, technology should not be used to hide poor shop-floor discipline.
A digital OEE dashboard with inaccurate data is still an inaccurate OEE dashboard.
17. Data Integrity Must Be Part of Digital OEE
When electronic systems are used to collect, process or report manufacturing data, data integrity becomes critical.
Relevant principles include:
- ALCOA+
- Appropriate user access
- Audit trails
- Controlled system changes
- Data security
- Backup and recovery
- Electronic records controls
- Applicable regulatory requirements such as 21 CFR Part 11 where relevant
Computerized systems supporting GMP operations should be appropriately assessed, qualified/validated and maintained according to the site’s procedures and applicable requirements.
The objective is not simply to automate OEE calculation.
The objective is to create trustworthy manufacturing information that people can use to make decisions.
18. Can AI Improve OEE?
AI and machine learning can potentially support OEE improvement through:
- Predictive maintenance
- Pattern recognition
- Anomaly detection
- Downtime prediction
- Process trend analysis
- Automated loss classification
- Production forecasting
For example, historical equipment data could potentially reveal patterns that occur before repeated failures.
But there is an important practical principle:
Do not use AI to solve a problem that has not first been understood using basic manufacturing discipline.
If downtime categories are inaccurate and machine data is unreliable, adding AI will not automatically produce a meaningful improvement.
19. Hypothetical Tablet Compression Case Study
Consider a hypothetical OSD manufacturing facility with a tablet compression machine.
Initial situation
The machine has an OEE of approximately 68%.
The team initially assumes the machine needs a higher operating speed.
A detailed loss analysis tells a different story.
| Loss Category | Contribution |
|---|---|
| Tooling-related stoppages | 24% |
| Changeover | 21% |
| Minor stoppages | 18% |
| Feeder-related issues | 14% |
| Breakdown | 10% |
| Other losses | 13% |
The team therefore decides not to simply increase machine speed.
Improvement actions
The cross-functional team:
- Reviews tooling history.
- Establishes tooling inspection criteria.
- Improves tooling preparation.
- Standardizes changeover activities.
- Reviews recurring feeder problems.
- Introduces better minor-stoppage recording.
- Strengthens preventive-maintenance checks.
- Reviews operator training.
- Conducts regular Pareto reviews.
After implementation and stabilization, the hypothetical OEE increases to approximately 78%.
These figures are illustrative only, not an industry benchmark.
The important lesson is the improvement approach.
The team improved the process by eliminating losses rather than simply demanding higher machine speed.
20. More Than 20 Practical OEE Improvement Actions
Pharmaceutical manufacturers can consider the following actions:
- Establish a reliable OEE baseline.
- Standardize OEE definitions across departments.
- Improve downtime classification.
- Create a daily top-loss Pareto.
- Investigate recurring breakdowns.
- Review preventive-maintenance effectiveness.
- Establish critical-spares lists.
- Improve tooling management.
- Standardize machine setup.
- Reduce avoidable changeover waiting.
- Prepare materials before scheduled production.
- Improve shift handover.
- Train operators on abnormality identification.
- Record minor stoppages systematically.
- Review repeated machine alarms.
- Analyze startup rejection.
- Review recurring quality defects.
- Improve process parameter monitoring.
- Review equipment performance trends.
- Conduct cross-functional OEE meetings.
- Use SMED principles where appropriate.
- Implement autonomous-maintenance activities.
- Improve production planning.
- Use digital dashboards where justified.
- Track corrective actions to closure.
- Standardize successful improvements.
- Review OEE trends by product and equipment.
- Use FMEA for recurring equipment/process risks.
- Link OEE improvement with CAPA where appropriate.
- Periodically reassess whether the ideal cycle time remains technically justified and appropriately controlled.
21. Common OEE Mistakes
Mistake 1: Manipulating downtime data
If downtime is incorrectly classified to make OEE look better, management loses visibility of the real problem.
Mistake 2: Focusing only on the OEE number
A single percentage cannot explain why performance changed.
Always look at:
Availability + Performance + Quality + Loss categories.
Mistake 3: Ignoring minor stoppages
Repeated small interruptions can represent a significant hidden loss.
Mistake 4: Using an unrealistic ideal cycle time
The ideal rate must have a sound technical basis.
Mistake 5: Treating OEE as a Production-only KPI
OEE losses may originate from Engineering, Maintenance, Warehouse, Quality, Planning, Utilities or process design.
Mistake 6: Chasing speed
Increasing machine speed without controlling quality and process stability can create additional losses.
Mistake 7: Collecting data without acting
A dashboard alone does not improve manufacturing.
Action improves manufacturing.
22. A Practical OEE Dashboard
A daily or weekly OEE dashboard can include:
| KPI | Current | Previous | Trend | Action |
|---|---|---|---|---|
| OEE | — | — | — | — |
| Availability | — | — | — | — |
| Performance | — | — | — | — |
| Quality | — | — | — | — |
| Breakdown hours | — | — | — | — |
| Changeover hours | — | — | — | — |
| Minor stoppages | — | — | — | — |
| Rejection | — | — | — | — |
| Top downtime cause | — | — | — | — |
| Action closure | — | — | — | — |
During daily production meetings, the team should focus on the largest losses and actions, rather than spending excessive time discussing the percentage alone.
23. OEE and GMP Compliance
This is perhaps the most important point for pharmaceutical manufacturing.
OEE improvement cannot be separated from GMP.
Any improvement should be evaluated against applicable requirements for:
- SOPs
- Equipment qualification
- Process validation
- Cleaning validation
- Change control
- Deviation management
- CAPA
- Data integrity
- Training
- Documentation
- Quality risk management
For example, reducing cleaning time may appear attractive from an OEE perspective.
But if the proposed reduction affects a validated cleaning process, the appropriate quality and validation assessment must be completed before implementation.
The same principle applies to:
- Machine-speed changes
- Process parameter changes
- Equipment modifications
- Software changes
- Automation
- New sensors
- New data systems
The fundamental principle is:
Operational efficiency should never be achieved by compromising product quality, patient safety, or regulatory compliance.
24. 30-60-90 Day OEE Improvement Plan
First 30 Days — Understand the Current State
Focus on:
- Establishing the baseline
- Verifying OEE calculations
- Standardizing definitions
- Improving downtime data
- Identifying top five losses
- Establishing equipment-wise loss trends
At this stage, resist the temptation to implement too many solutions.
First understand the problem.
Days 31–60 — Attack the Major Losses
Focus on:
- Pareto analysis
- Root-cause investigations
- Equipment reliability
- Changeover improvement
- Tooling management
- Minor-stop reduction
- Operator training
- Material availability
- Corrective and preventive actions
Select a manageable number of high-impact improvement projects.
Days 61–90 — Standardize and Sustain
Focus on:
- Standardizing successful improvements
- Updating controlled procedures where required
- Monitoring trends
- Establishing routine OEE reviews
- Digitalizing data where justified
- Strengthening cross-functional ownership
- Reviewing action effectiveness
- Creating a continuous-improvement governance structure
The objective is not a temporary OEE increase.
It is sustained loss reduction.
25. Key Takeaways
Improving OEE in pharmaceutical manufacturing is not about making machines run continuously.
It is about understanding and systematically eliminating the losses that prevent the manufacturing process from performing effectively.
The most important principles are:
- Start with reliable data.
- Understand Availability, Performance and Quality separately.
- Use Pareto analysis to identify the biggest losses.
- Investigate recurring losses rather than repeatedly correcting symptoms.
- Involve Production, Engineering, Maintenance, QA, Warehouse and Planning.
- Do not ignore minor stoppages.
- Improve changeovers without compromising GMP controls.
- Use operators as an important source of shop-floor knowledge.
- Use digitalization to improve visibility, not to replace basic manufacturing discipline.
- Never compromise product quality, patient safety or compliance for a higher OEE number.
The most successful OEE programs are usually not built around one major project.
They are built around many disciplined improvements: a shorter changeover here, fewer recurring stoppages there, better tooling management, improved maintenance, faster response to abnormalities, fewer startup defects and better coordination between functions.
Over time, these small improvements can make a meaningful difference.
OEE is ultimately not just a number on a dashboard. It is a way of understanding how effectively the entire manufacturing system is working.
Frequently Asked Questions
1. What is a good OEE for pharmaceutical manufacturing?
There is no single OEE percentage that should automatically be considered appropriate for every pharmaceutical facility. Product characteristics, equipment design, batch size, changeover requirements, cleaning processes and manufacturing strategy can significantly influence OEE.
The more useful approach is to establish a reliable baseline and continuously reduce the major controllable losses.
2. How can OEE be improved in tablet manufacturing?
Start by identifying the major losses in compression, including breakdowns, tooling problems, changeovers, minor stoppages, reduced speed and tablet rejection. Pareto analysis and root-cause investigation can then be used to prioritize improvements.
3. Does increasing machine speed improve OEE?
Not necessarily. Higher speed can improve performance only when the process remains stable and within approved operating conditions. If increased speed produces more rejection, stoppages or quality problems, overall OEE may actually decline.
4. How does maintenance affect OEE?
Effective preventive, predictive and corrective maintenance can improve equipment availability by reducing unexpected failures and recurring equipment problems.
5. Can OEE be used in GMP manufacturing?
Yes. OEE can be a useful manufacturing-performance measure in GMP environments when data is collected and managed appropriately and improvement activities remain within applicable GMP, validation, change-control and data-integrity requirements.
6. How can SMED help pharmaceutical manufacturing?
SMED principles can help identify activities that can be prepared before equipment downtime and opportunities to perform appropriate tasks in parallel. Pharmaceutical cleaning, line clearance, validation and QA requirements must remain fully controlled.
7. What is the biggest mistake when implementing OEE?
One common mistake is focusing on the OEE percentage without understanding the underlying losses. An OEE number becomes useful when it leads to specific, measurable loss-reduction actions.
References & Further Reading
- U.S. FDA — Process Validation: General Principles and Practices (https://www.fda.gov/regulatory-information/search-fda-guidance-documents/process-validation-general-principles-and-practices?utm_source=chatgpt.com)
- U.S. FDA — Data Integrity and Compliance With Drug CGMP: Questions and Answers (https://www.fda.gov/regulatory-information/search-fda-guidance-documents/data-integrity-and-compliance-drug-cgmp-questions-and-answers?trk=article-ssr-frontend-pulse_little-text-block&utm_source=chatgpt.com)
- ICH — Quality Guidelines: Q9 Quality Risk Management and Q10 Pharmaceutical Quality System (https://admin.ich.org/page/quality-guidelines?utm_source=chatgpt.com)
- ISPE — GAMP® Guidance (https://ispe.org/topics/gamp?utm_source=chatgpt.com) ISPE — GAMP® 5: A Risk-Based Approach to Compliant GxP Computerized Systems, Second Edition (https://ispe.org/publications/guidance-documents/gamp-5-guide-2nd-edition/?utm_source=chatgpt.com)
- U.S. FDA — Questions and Answers on Current Good Manufacturing Practice Regulations: Production and Process Controls (https://www.fda.gov/drugs/guidances-drugs/questions-and-answers-current-good-manufacturing-practice-regulations-production-and-process?utm_source=chatgpt.com)
About the Author
Ramesh Palav is a pharmaceutical manufacturing professional with 21+ years of experience in OSD manufacturing, GMP, operational excellence, qualification, validation, QMS and continuous improvement. His expertise includes tablet manufacturing, OEE improvement, CAPA, FMEA, root cause analysis, CSV and regulatory audit readiness. Through Pharma Manufacturing Hub, he shares practical insights to help pharmaceutical professionals improve manufacturing performance, quality and compliance.