
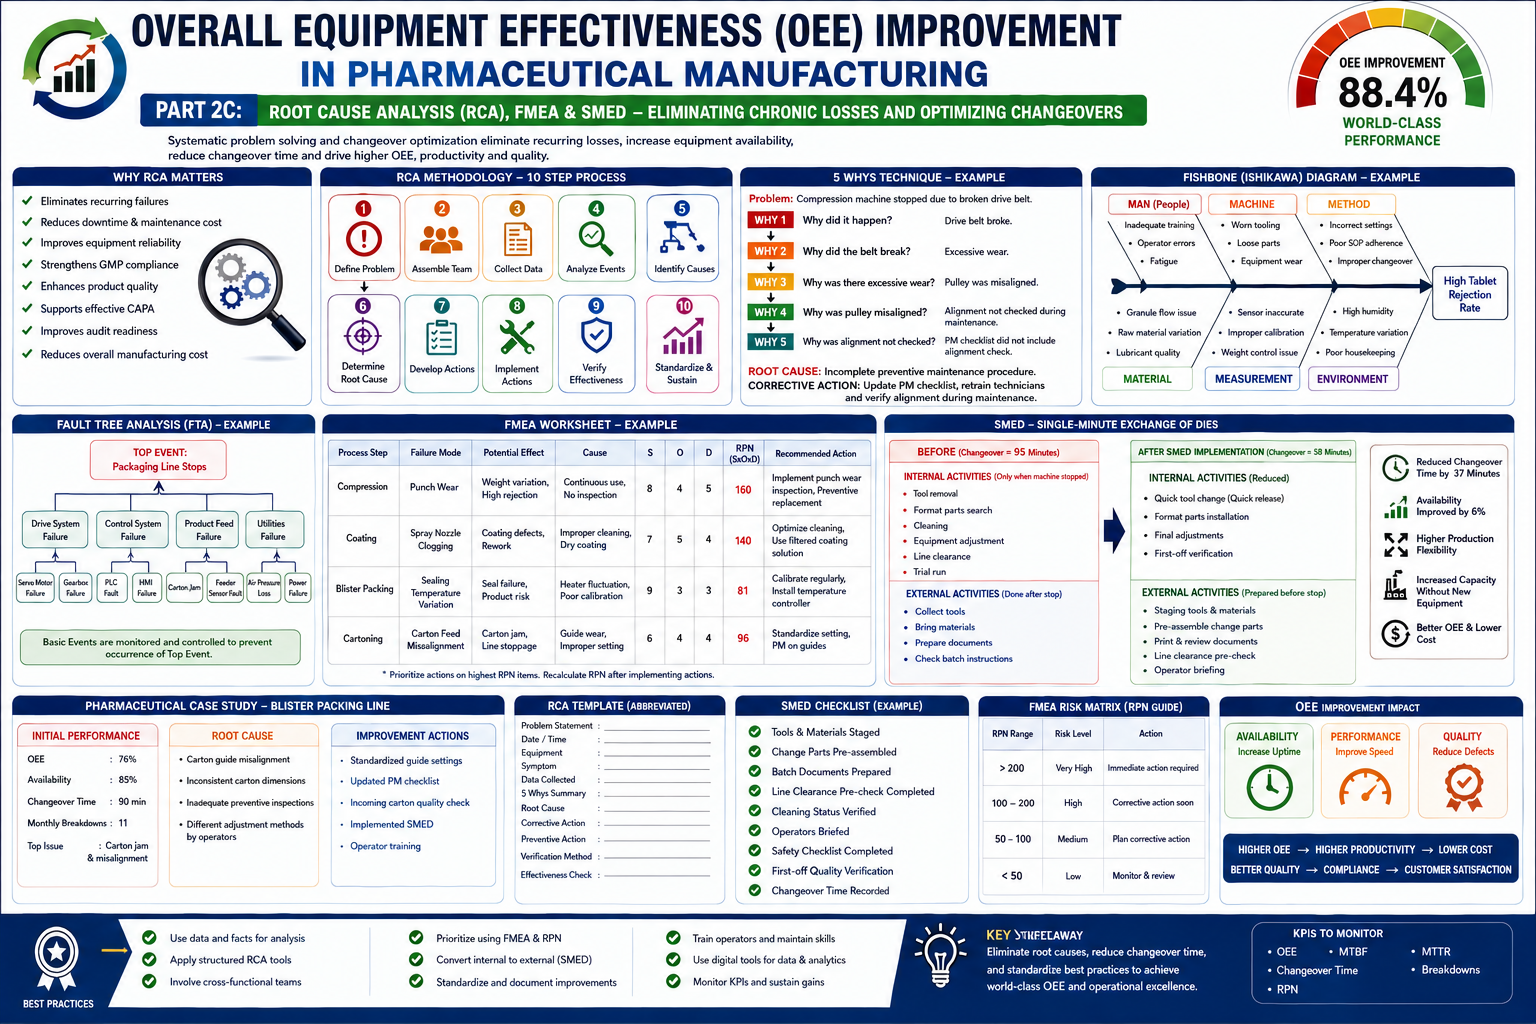
Part 2C: Root Cause Analysis (RCA), FMEA & SMED – Eliminating Chronic Losses and Optimizing Changeovers
A Professional Guide for Pharmaceutical Manufacturing Excellence
Table of Contents
- Introduction
- Why Root Cause Analysis (RCA) Matters
- The Cost of Recurring Equipment Failures
- The Structured RCA Methodology
- The 5 Whys Technique
- Fishbone (Ishikawa) Diagram
- Fault Tree Analysis (FTA)
- Failure Mode and Effects Analysis (FMEA)
- Single-Minute Exchange of Dies (SMED)
- Pharmaceutical Changeover Optimization
- OEE Improvement Through RCA and SMED
- Digital RCA and Pharma 4.0
- Pharmaceutical Case Study
- GMP & Regulatory Considerations
- RCA, FMEA & SMED Templates
- Implementation Roadmap
- Best Practices
- Key Takeaways
1. Introduction
Many pharmaceutical manufacturers repeatedly experience the same equipment breakdowns, lengthy changeovers, and recurring quality issues. While teams often restore production quickly, the underlying causes remain unresolved, leading to repeated downtime, higher maintenance costs, reduced OEE, and increased compliance risk.
This is where Root Cause Analysis (RCA), Failure Mode and Effects Analysis (FMEA), and Single-Minute Exchange of Dies (SMED) become essential. Together, these methodologies enable organizations to move from reactive problem-solving to a proactive, data-driven improvement culture.
By systematically identifying failure mechanisms, prioritizing risks, and reducing setup times, pharmaceutical manufacturers can achieve sustainable improvements in Availability, Performance, and Quality—the three pillars of Overall Equipment Effectiveness (OEE).
2. Why Root Cause Analysis Matters
A common mistake in maintenance is correcting the immediate symptom rather than eliminating the underlying cause.
Example
A tablet compression machine stops due to a broken drive belt.
- Symptom: Broken belt replaced.
- Underlying Cause: Pulley misalignment and inadequate tension inspection.
- Root Cause: Preventive maintenance checklist did not include belt alignment verification.
Without addressing the true root cause, the failure is likely to recur.
Benefits of RCA
- Eliminates recurring failures
- Reduces downtime
- Improves equipment reliability
- Strengthens GMP compliance
- Enhances product quality
- Supports effective CAPA
- Improves audit readiness
- Reduces maintenance costs
3. The Cost of Recurring Equipment Failures
Recurring failures have a cumulative impact on operations:
- Increased unplanned downtime
- Higher maintenance labor costs
- More spare parts consumption
- Production delays
- Batch release delays
- Regulatory investigations
- Customer supply risks
- Reduced employee confidence
A structured RCA process prevents these hidden costs from becoming chronic.
4. The Structured RCA Methodology
A disciplined RCA process typically follows these steps:
- Define the problem clearly.
- Assemble a cross-functional team.
- Collect factual data (downtime logs, alarms, trends).
- Analyze the sequence of events.
- Identify possible causes.
- Determine the root cause(s).
- Develop corrective and preventive actions.
- Implement solutions.
- Verify effectiveness.
- Standardize and sustain improvements.
5. The 5 Whys Technique
The 5 Whys is a simple but powerful questioning technique to drill down to the fundamental cause of a problem.
Example: Tablet Compression Downtime
Problem: Compression machine stopped.
- Why?
The main drive belt broke. - Why did the belt break?
Excessive wear. - Why was there excessive wear?
The pulley was misaligned. - Why was the pulley misaligned?
Alignment was not checked during maintenance. - Why was alignment not checked?
The preventive maintenance checklist lacked this inspection point.
Root Cause: Incomplete preventive maintenance procedure.
Corrective Action: Update the PM checklist, retrain technicians, and verify alignment during scheduled maintenance.
6. Fishbone (Ishikawa) Diagram
The Fishbone Diagram categorizes potential causes into logical groups, helping teams explore all contributing factors.
Common Categories
- Man (People): Training, skills, staffing
- Machine: Equipment condition, wear, calibration
- Method: SOPs, changeover process, maintenance procedures
- Material: Raw material quality, packaging components
- Measurement: Instrument accuracy, sensor reliability
- Environment: Temperature, humidity, utilities, cleanliness
Example: High Tablet Rejection Rate
Potential causes may include:
- Inadequate operator training
- Worn compression tooling
- Incorrect compression force
- Poor granule flow
- Faulty weight control sensor
- High humidity affecting granule properties
The Fishbone Diagram provides a structured starting point for deeper investigation.
7. Fault Tree Analysis (FTA)
Fault Tree Analysis is a top-down, logic-based approach that maps how combinations of failures lead to a specific undesirable event.
Top Event: Packaging Line Stops
Possible contributing failures:
- Servo motor failure
- PLC communication fault
- Air pressure loss
- Carton feeder jam
- Vision system error
By tracing these logical relationships, teams can identify critical failure paths and implement targeted preventive measures.
8. Failure Mode and Effects Analysis (FMEA)
FMEA is a proactive risk assessment tool used to identify potential failure modes before they occur.
Key Elements
- Failure Mode
- Effect of Failure
- Cause of Failure
- Severity (S)
- Occurrence (O)
- Detection (D)
- Risk Priority Number (RPN = S × O × D)
Example FMEA
| Failure Mode | Effect | Cause | S | O | D | RPN |
|---|---|---|---|---|---|---|
| Bearing Failure | Machine stops | Inadequate lubrication | 9 | 5 | 4 | 180 |
| Sensor Failure | Incorrect tablet count | Dust contamination | 6 | 4 | 5 | 120 |
| PLC Fault | Complete line stoppage | Power fluctuation | 10 | 2 | 3 | 60 |
Risk Reduction Actions
- Increase lubrication frequency.
- Install predictive vibration monitoring.
- Improve sensor cleaning routines.
- Add UPS protection for PLC systems.
Recalculate the RPN after implementing improvements to confirm risk reduction.
9. Single-Minute Exchange of Dies (SMED)
Developed within Lean Manufacturing, SMED aims to reduce equipment changeover time to less than 10 minutes wherever practical.
In pharmaceutical manufacturing, SMED improves:
- Equipment availability
- Production flexibility
- Campaign planning
- Batch scheduling
- OEE
Internal vs. External Activities
Internal Activities (performed only when the machine is stopped)
- Tool replacement
- Format part installation
- Final equipment adjustments
External Activities (performed while the machine is still running or before shutdown)
- Staging tools
- Preparing materials
- Printing labels
- Reviewing batch documentation
- Pre-assembling change parts
Converting internal tasks into external tasks is the core principle of SMED.
10. Pharmaceutical Changeover Optimization
Efficient changeovers require careful planning while maintaining GMP compliance.
Best Practices
- Standardize changeover SOPs.
- Use color-coded change parts.
- Prepare tools and materials in advance.
- Employ quick-release clamps and modular fixtures.
- Implement visual checklists.
- Conduct line clearance using standardized forms.
- Verify cleaning readiness before shutdown.
- Digitize changeover documentation where possible.
Example
Before Improvement
- Average Changeover: 95 minutes
After SMED Implementation
- External preparation increased.
- Tool organization improved.
- Parallel activities introduced.
- Visual management adopted.
Result
- Average Changeover: 58 minutes
- Availability improved by 6%
- Additional production capacity gained without new equipment
11. OEE Improvement Through RCA and SMED
Systematic RCA and SMED initiatives produce measurable improvements:
| Metric | Before | After |
|---|---|---|
| Availability | 88% | 94% |
| Performance | 91% | 95% |
| Quality | 98% | 99% |
| OEE | 78.5% | 88.4% |
Key Drivers
- Fewer recurring failures
- Reduced changeover time
- Improved equipment stability
- Better operator preparedness
12. Digital RCA and Pharma 4.0
Modern digital tools enhance RCA by providing real-time operational data.
Technologies
- MES event logs
- SCADA alarms
- PLC diagnostics
- IIoT sensors
- CMMS maintenance history
- AI-driven anomaly detection
- Digital Twin simulations
- Advanced dashboards
These systems reduce manual data collection and accelerate problem identification.
13. Pharmaceutical Case Study
Scenario
A blister packaging line experienced repeated downtime due to carton feeding issues.
Initial Performance
| Metric | Value |
|---|---|
| OEE | 76% |
| Availability | 85% |
| Average Changeover | 90 min |
| Monthly Breakdowns | 11 |
Investigation
RCA identified:
- Carton guide misalignment
- Inconsistent carton dimensions
- Inadequate preventive inspections
- Operators using different adjustment methods
Improvement Actions
- Standardized guide settings.
- Updated preventive maintenance checklist.
- Introduced incoming carton quality checks.
- Implemented SMED principles.
- Retrained operators.
Results (After 4 Months)
| Metric | Before | After |
|---|---|---|
| OEE | 76% | 89% |
| Availability | 85% | 95% |
| Changeover Time | 90 min | 55 min |
| Breakdowns | 11 | 3 |
14. GMP & Regulatory Considerations
All RCA, FMEA, and SMED activities must align with pharmaceutical quality systems.
Key considerations include:
- Document investigations thoroughly.
- Link RCA outcomes to CAPA where appropriate.
- Evaluate the impact of changes through formal change control.
- Assess risks before implementing modifications.
- Update SOPs and training records.
- Maintain equipment qualification status.
- Ensure electronic records comply with ALCOA+ principles.
- Verify that improvements do not compromise validated processes.
15. Practical Templates
RCA Investigation Template
| Item | Description |
|---|---|
| Problem Statement | |
| Equipment | |
| Date & Time | |
| Symptoms | |
| Data Collected | |
| 5 Whys Analysis | |
| Root Cause | |
| Corrective Action | |
| Preventive Action | |
| Verification of Effectiveness |
FMEA Worksheet
| Process Step | Failure Mode | Effect | Cause | S | O | D | RPN | Action |
|---|
SMED Checklist
- Tools staged before shutdown
- Materials verified and available
- Batch documentation prepared
- Change parts inspected
- Cleaning equipment ready
- Line clearance completed
- Operators assigned clear responsibilities
- First-off quality verification performed
16. Implementation Roadmap
| Phase | Key Activities |
|---|---|
| 1 | Collect downtime and changeover data |
| 2 | Identify recurring losses using Pareto analysis |
| 3 | Conduct RCA for high-impact failures |
| 4 | Perform FMEA on critical equipment |
| 5 | Prioritize actions based on RPN |
| 6 | Implement SMED improvements |
| 7 | Train operators and maintenance personnel |
| 8 | Monitor KPIs (Availability, MTBF, MTTR, OEE) |
| 9 | Verify effectiveness and standardize successful practices |
| 10 | Drive continuous improvement through periodic reviews |
17. Best Practices
- Base investigations on objective data, not assumptions.
- Involve production, maintenance, engineering, and quality teams in RCA.
- Use structured tools consistently.
- Prioritize high-risk failures through FMEA.
- Convert internal changeover tasks to external tasks wherever feasible.
- Standardize successful improvements in SOPs and training.
- Leverage digital systems for faster analysis and decision-making.
- Measure results using OEE and maintenance KPIs.
- Sustain gains through audits and continuous improvement.
18. Key Takeaways
- Root Cause Analysis (RCA) eliminates the underlying causes of recurring failures, reducing downtime and improving equipment reliability.
- Failure Mode and Effects Analysis (FMEA) provides a proactive, risk-based approach to preventing equipment and process failures before they occur.
- Single-Minute Exchange of Dies (SMED) significantly reduces changeover time, enhancing equipment availability and manufacturing flexibility without compromising GMP requirements.
- Combining RCA, FMEA, and SMED with TPM, Lean Manufacturing, Six Sigma, and digital technologies creates a robust framework for sustainable OEE improvement.
- Standardized investigations, risk assessments, and changeover practices—supported by real-time data from MES, SCADA, CMMS, and IIoT systems—enable pharmaceutical manufacturers to achieve world-class operational excellence while maintaining product quality, patient safety, and regulatory compliance.
Coming in Part 3A: Performance Improvement – Eliminating Speed Losses and Maximizing Throughput
The next part of this series will focus on improving the Performance component of OEE, including:
- Understanding Performance Losses
- Minor Stops and Micro-Stoppage Analysis
- Reduced Speed Losses
- Lean Manufacturing Techniques
- Line Balancing and Bottleneck Analysis
- Statistical Process Control (SPC)
- Cycle Time Optimization
- Operator Efficiency
- AI-Driven Performance Monitoring
- Real-World Pharmaceutical Case Studies
- Performance KPIs, Dashboards, Templates, and Best Practices for achieving world-class manufacturing performance.
About the Author
Ramesh Palav is a seasoned professional in GxP Quality, Computer System Validation (CSV), Data Integrity, and Pharmaceutical IT Compliance. He has extensive experience in implementing and managing GxP computerized systems, risk-based validation, audit trails, data integrity, and regulatory compliance. Through his articles and professional insights, he aims to share practical knowledge and help pharmaceutical and life-sciences professionals strengthen quality, compliance, and data integrity.